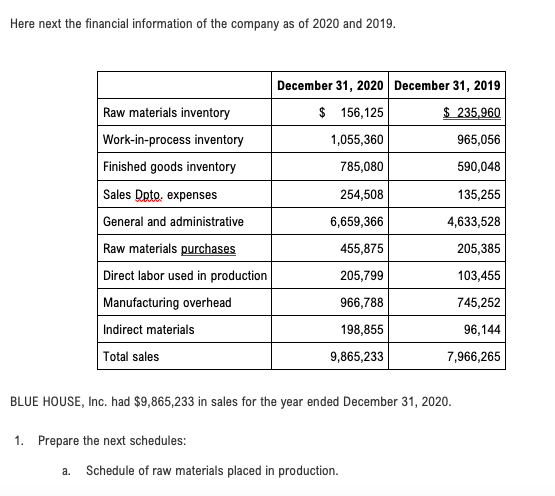
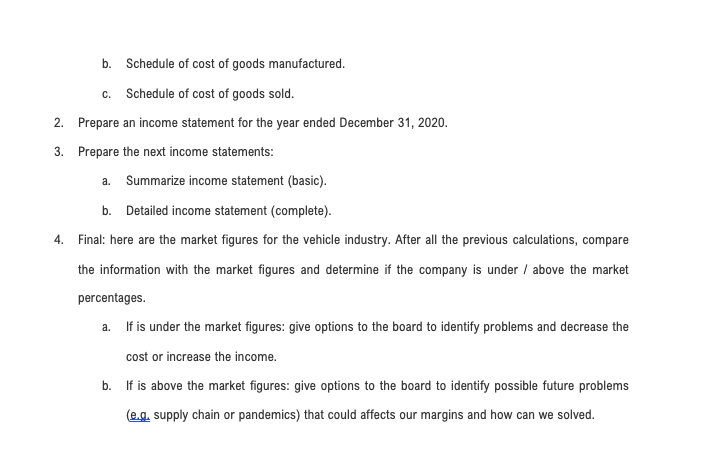
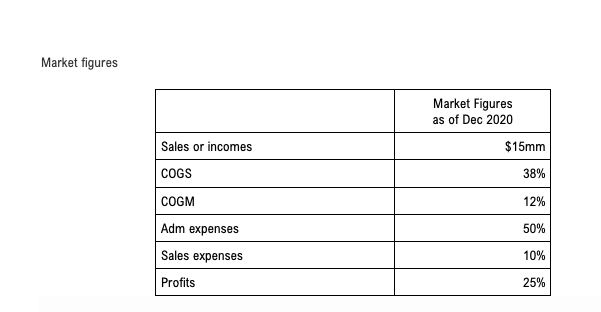
BLUE HOUSE Inc. it is a manufacturing company who have multiple facilities around North America. BLUE HOUSE builds technological pieces for the vehicle industries and other pieces for other industries in computer industries. Here next the financial information of the company as of 2020 and 2019. BLUE HOUSE, Inc. had 89,865,233 in sales for the year ended December 31, 2020. 1. Prepare the next schedules: 2. Schedule of raw materials placed in production. 3. Schedule of cost of goods manufactured. Schedule of cost of goods sold. . Prepare an income statement for the year ended December 31, 2020. 6. Prepare the next income statements: 7. Summarize income statement (basic). Detailed income statement (complete). Final: here are the market figures for the vehicle industry.After all the previous calculations, compare the information with the marketfigures and determine if the company is under / above the market percentages. 10. If is under the market figures: give options to the board toidentify problems and decrease the cost or increase the income. 11. If is above the market figures: give options to the board toidentify possible future problems (e.g. supply chain or pandemics) that couldaffects our margins and how can we solved. 8. 9. BLUE HOUSE Inc. it is a manufacturing company who have multiple facilities around North America. BLUE HOUSE builds technological pieces for the vehicle industries and other pieces for other industries in computer industries. Here next the financial information of the company as of 2020 and 2019. Here next the financial information of the company as of 2020 and 2019. December 31, 2020 December 31, 2019 $ 156,125 $ 235,960 1,055,360 965,056 785,080 590,048 254,508 135,255 6,659,366 4,633,528 Raw materials inventory Work-in-process inventory Finished goods inventory Sales Dete, expenses General and administrative Raw materials purchases Direct labor used in production Manufacturing overhead Indirect materials Total sales 455,875 205,385 205,799 103,455 966,788 745,252 198,855 96,144 9,865,233 7,966,265 BLUE HOUSE, Inc. had $9,865,233 in sales for the year ended December 31, 2020. 1. Prepare the next schedules: a. Schedule of raw materials placed in production. b. Schedule of cost of goods manufactured. C. Schedule of cost of goods sold. 2. Prepare an income statement for the year ended December 31, 2020. 3. Prepare the next income statements: a. Summarize income statement (basic). b. Detailed income statement (complete). 4. Final: here are the market figures for the vehicle industry. After all the previous calculations, compare the information with the market figures and determine if the company is under / above the market percentages. a. If is under the market figures: give options to the board to identify problems and decrease the cost or increase the income. b. If is above the market figures: give options to the board to identify possible future problems (eg, supply chain or pandemics) that could affects our margins and how can we solved. Market figures Market Figures as of Dec 2020 $15mm Sales or incomes COGS 38% COGM 12% Adm expenses 50% Sales expenses 10% Profits 25% BLUE HOUSE Inc. it is a manufacturing company who have multiple facilities around North America. BLUE HOUSE builds technological pieces for the vehicle industries and other pieces for other industries in computer industries. Here next the financial information of the company as of 2020 and 2019. BLUE HOUSE, Inc. had 89,865,233 in sales for the year ended December 31, 2020. 1. Prepare the next schedules: 2. Schedule of raw materials placed in production. 3. Schedule of cost of goods manufactured. Schedule of cost of goods sold. . Prepare an income statement for the year ended December 31, 2020. 6. Prepare the next income statements: 7. Summarize income statement (basic). Detailed income statement (complete). Final: here are the market figures for the vehicle industry.After all the previous calculations, compare the information with the marketfigures and determine if the company is under / above the market percentages. 10. If is under the market figures: give options to the board toidentify problems and decrease the cost or increase the income. 11. If is above the market figures: give options to the board toidentify possible future problems (e.g. supply chain or pandemics) that couldaffects our margins and how can we solved. 8. 9. BLUE HOUSE Inc. it is a manufacturing company who have multiple facilities around North America. BLUE HOUSE builds technological pieces for the vehicle industries and other pieces for other industries in computer industries. Here next the financial information of the company as of 2020 and 2019. Here next the financial information of the company as of 2020 and 2019. December 31, 2020 December 31, 2019 $ 156,125 $ 235,960 1,055,360 965,056 785,080 590,048 254,508 135,255 6,659,366 4,633,528 Raw materials inventory Work-in-process inventory Finished goods inventory Sales Dete, expenses General and administrative Raw materials purchases Direct labor used in production Manufacturing overhead Indirect materials Total sales 455,875 205,385 205,799 103,455 966,788 745,252 198,855 96,144 9,865,233 7,966,265 BLUE HOUSE, Inc. had $9,865,233 in sales for the year ended December 31, 2020. 1. Prepare the next schedules: a. Schedule of raw materials placed in production. b. Schedule of cost of goods manufactured. C. Schedule of cost of goods sold. 2. Prepare an income statement for the year ended December 31, 2020. 3. Prepare the next income statements: a. Summarize income statement (basic). b. Detailed income statement (complete). 4. Final: here are the market figures for the vehicle industry. After all the previous calculations, compare the information with the market figures and determine if the company is under / above the market percentages. a. If is under the market figures: give options to the board to identify problems and decrease the cost or increase the income. b. If is above the market figures: give options to the board to identify possible future problems (eg, supply chain or pandemics) that could affects our margins and how can we solved. Market figures Market Figures as of Dec 2020 $15mm Sales or incomes COGS 38% COGM 12% Adm expenses 50% Sales expenses 10% Profits 25%