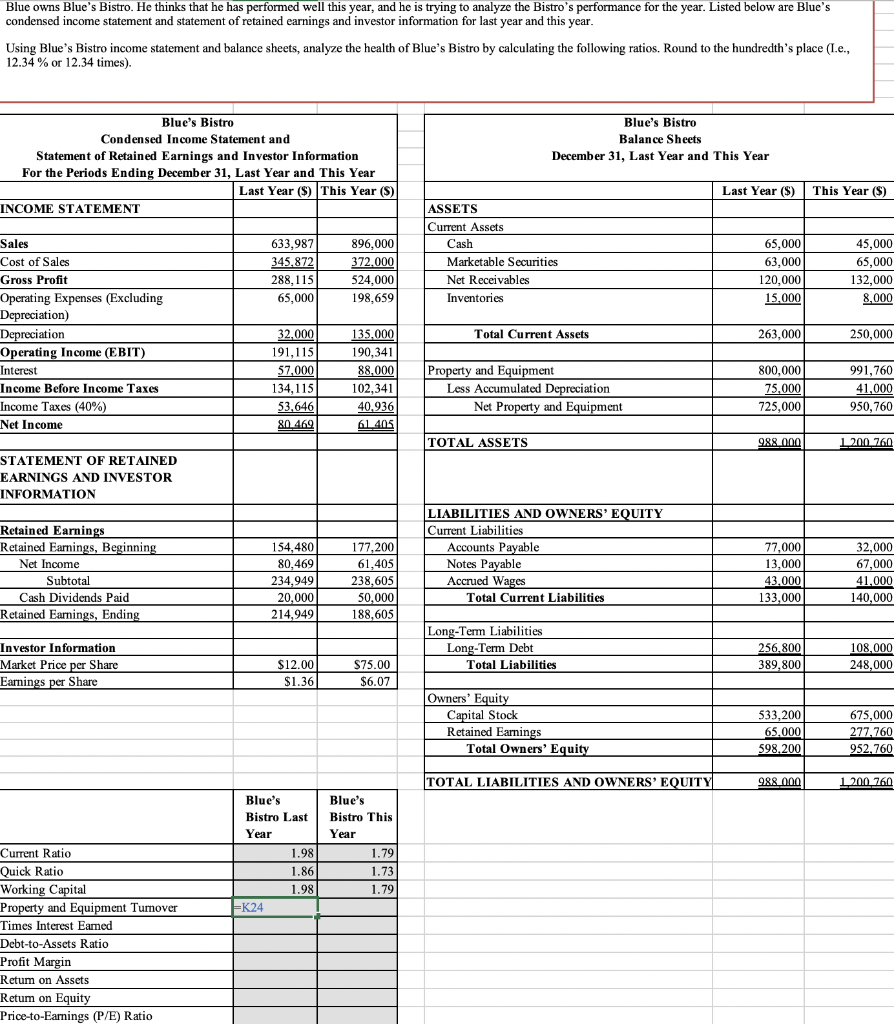
Blue owns Blue's Bistro. He thinks that he has performed well this year, and he is trying to analyze the Bistro's performance for the year. Listed below are Blue's condensed income statement and statement of retained earnings and investor information for last year and this year. Using Blue's Bistro income statement and balance sheets, analyze the health of Blue's Bistro by calculating the following ratios, Round to the hundredth's place (T.e., 12.34% or 12.34 times). Blue's Bistro Balance Sheets December 31, Last Year and This Year , Blue's Bistro Condensed Income Statement and Statement of Retained Earnings and Investor Information For the Periods Ending December 31, Last Year and This Year Last Year ($) This Year (S) INCOME STATEMENT Last Year ($) This Year ($) 633,987 345.872 288,115 65,000 896,000 372.000 524.000 198,659 ASSETS Current Assets Cash Marketable Securities Net Receivables Inventories 65,000 63,000 120,000 15.000 45,000 65,000 132.000 8,000 Sales Cost of Sales Gross Profit Operating Expenses (Excluding Depreciation) Depreciation Operating Income (EBIT) Interest Income Before Income Taxes Income Taxes (40%) Net Income Total Current Assets 263,000 250,000 32.000 191,115 57,000 134, 115 53,646 80 469 135,000 190,341 88,000 102,341 40.936 61.405 Property and Equipment Less Accumulated Depreciation Net Property and Equipment 800,000 75,000 725,000 991,760 41,000 950,760 TOTAL ASSETS 988.000 1 200 760 STATEMENT OF RETAINED EARNINGS AND INVESTOR INFORMATION Retained Earnings Retained Earnings, Beginning Net Income Subtotal Cash Dividends Paid Retained Earnings, Ending 154,480 80,469 234,949 20,000 214,949 177,200 61,405 238,605 50,000 188,6051 LIABILITIES AND OWNERS' EQUITY Current Liabilities Accounts Payable Notes Payable Accrued Wages Total Current Liabilities 77,000 13,000 43.000 133.000 32,000 67,000 41.000 140,000 Investor Information Market Price per Share Earnings per Share Long-Term Liabilities Long-Term Debt Total Liabilities 256.800 389,800 108,000 248.000 $12.00 $1.36 $75.00 $6.07 Owners' Equity Capital Stock Retained Earnings Total Owners' Equity 533,200 65.000 598.200 675,000 277.760 952.760 TOTAL LIABILITIES AND OWNERS' EQUITY 988 000 1 1 200 760 Blue's Bistro Last Year Blue's Bistro This Year 1.79 1.73 1.79 1.98 1.86 1.98 FK24 Current Ratio Quick Ratio Working Capital Property and Equipment Tumover Times Interest Eamed Debt-to-Assets Ratio Profit Margin Retum on Assets Retum on Equity Price-to-Earnings (P/E) Ratio Blue owns Blue's Bistro. He thinks that he has performed well this year, and he is trying to analyze the Bistro's performance for the year. Listed below are Blue's condensed income statement and statement of retained earnings and investor information for last year and this year. Using Blue's Bistro income statement and balance sheets, analyze the health of Blue's Bistro by calculating the following ratios, Round to the hundredth's place (T.e., 12.34% or 12.34 times). Blue's Bistro Balance Sheets December 31, Last Year and This Year , Blue's Bistro Condensed Income Statement and Statement of Retained Earnings and Investor Information For the Periods Ending December 31, Last Year and This Year Last Year ($) This Year (S) INCOME STATEMENT Last Year ($) This Year ($) 633,987 345.872 288,115 65,000 896,000 372.000 524.000 198,659 ASSETS Current Assets Cash Marketable Securities Net Receivables Inventories 65,000 63,000 120,000 15.000 45,000 65,000 132.000 8,000 Sales Cost of Sales Gross Profit Operating Expenses (Excluding Depreciation) Depreciation Operating Income (EBIT) Interest Income Before Income Taxes Income Taxes (40%) Net Income Total Current Assets 263,000 250,000 32.000 191,115 57,000 134, 115 53,646 80 469 135,000 190,341 88,000 102,341 40.936 61.405 Property and Equipment Less Accumulated Depreciation Net Property and Equipment 800,000 75,000 725,000 991,760 41,000 950,760 TOTAL ASSETS 988.000 1 200 760 STATEMENT OF RETAINED EARNINGS AND INVESTOR INFORMATION Retained Earnings Retained Earnings, Beginning Net Income Subtotal Cash Dividends Paid Retained Earnings, Ending 154,480 80,469 234,949 20,000 214,949 177,200 61,405 238,605 50,000 188,6051 LIABILITIES AND OWNERS' EQUITY Current Liabilities Accounts Payable Notes Payable Accrued Wages Total Current Liabilities 77,000 13,000 43.000 133.000 32,000 67,000 41.000 140,000 Investor Information Market Price per Share Earnings per Share Long-Term Liabilities Long-Term Debt Total Liabilities 256.800 389,800 108,000 248.000 $12.00 $1.36 $75.00 $6.07 Owners' Equity Capital Stock Retained Earnings Total Owners' Equity 533,200 65.000 598.200 675,000 277.760 952.760 TOTAL LIABILITIES AND OWNERS' EQUITY 988 000 1 1 200 760 Blue's Bistro Last Year Blue's Bistro This Year 1.79 1.73 1.79 1.98 1.86 1.98 FK24 Current Ratio Quick Ratio Working Capital Property and Equipment Tumover Times Interest Eamed Debt-to-Assets Ratio Profit Margin Retum on Assets Retum on Equity Price-to-Earnings (P/E) Ratio