BMGT 230, Exercise Set 7, Due 14 April 2023 (on-line, by 11:59 pm College Park time) 1. Determine whether the samples in each situation below
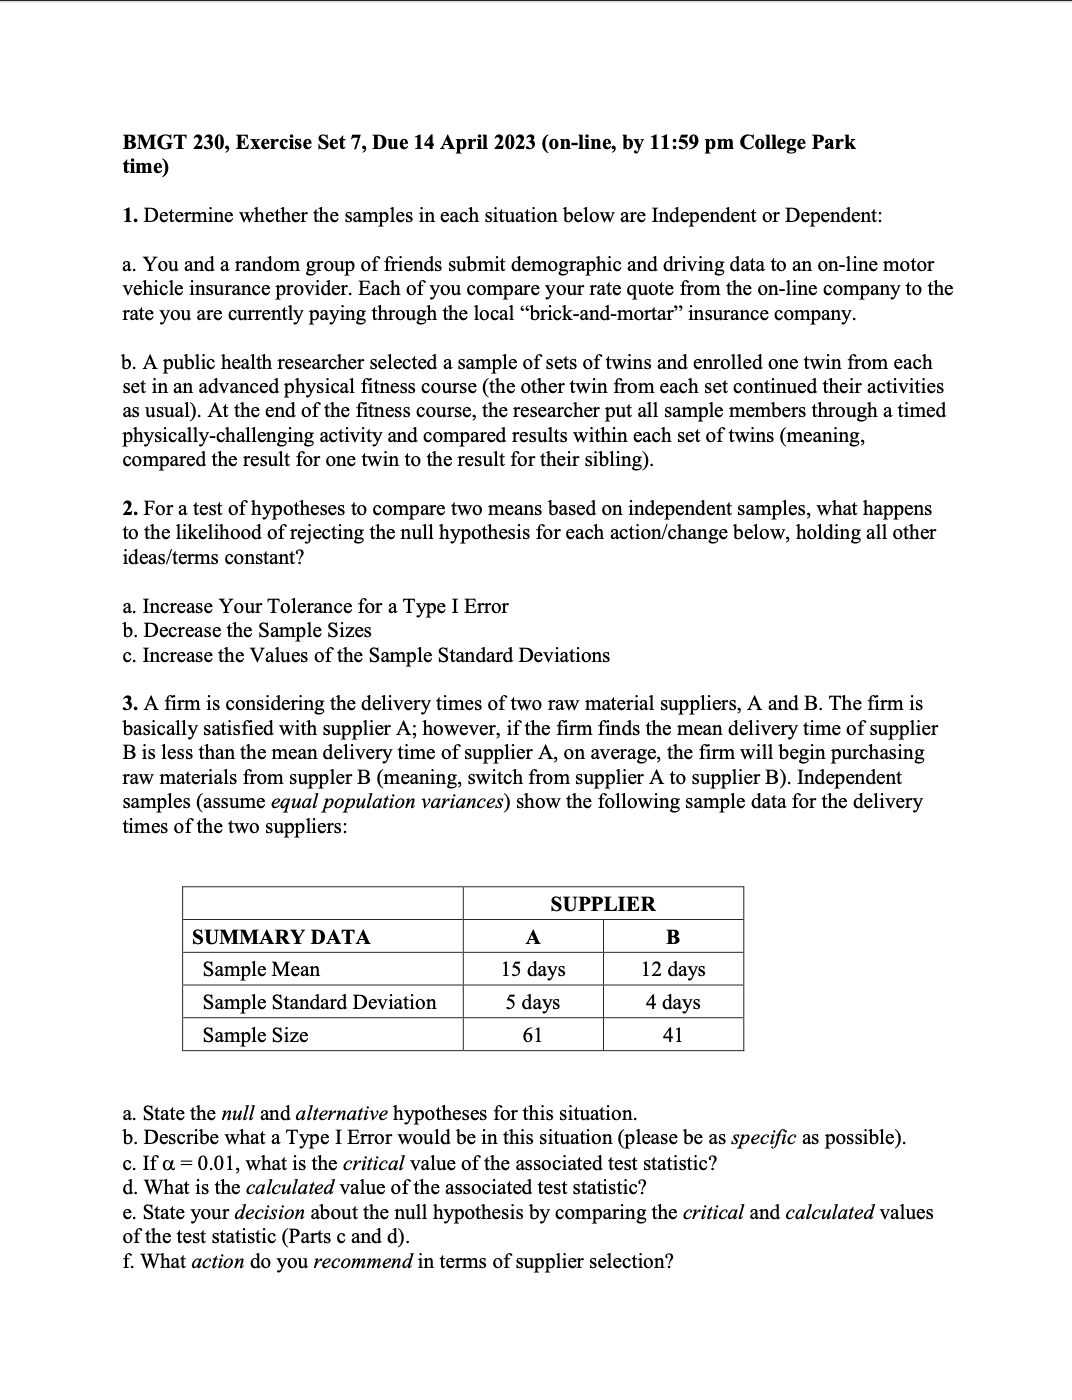
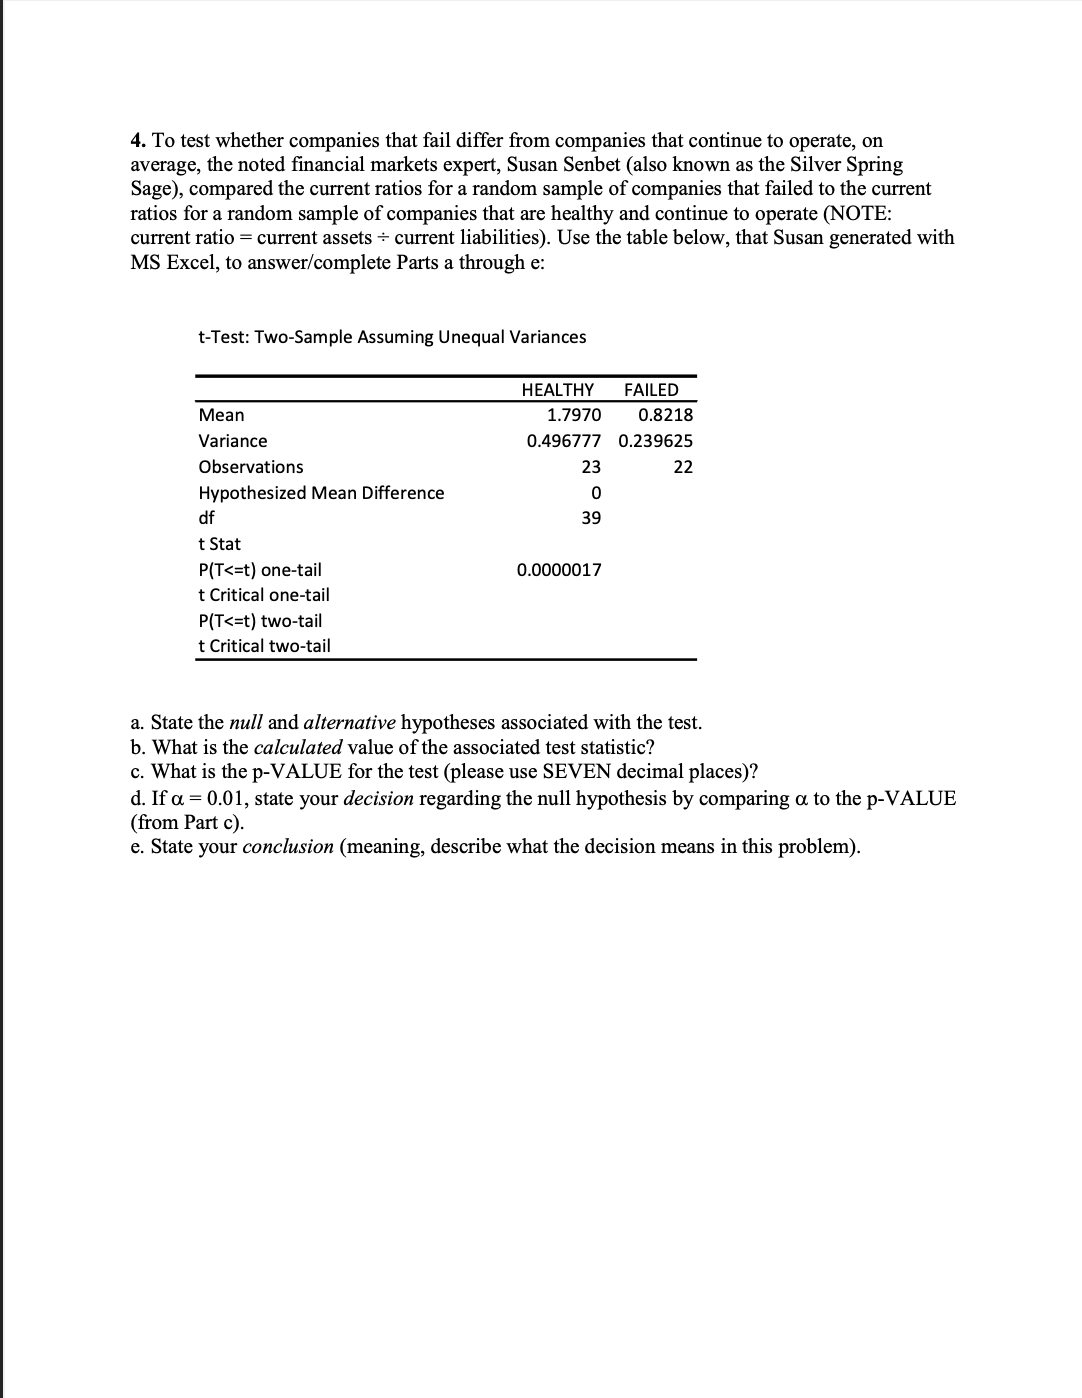
BMGT 230, Exercise Set 7, Due 14 April 2023 (on-line, by 11:59 pm College Park time) 1. Determine whether the samples in each situation below are Independent or Dependent: a. You and a random group of friends submit demographic and driving data to an on-line motor vehicle insurance provider. Each of you compare your rate quote from the on-line company to the rate you are currently paying through the local \"brick-and-mortar\" insurance company. b. A public health researcher selected a sample of sets of twins and enrolled one twin from each set in an advanced physical tness course (the other twin from each set continued their activities as usual). At the end of the tness course, the researcher put all sample members through a timed physically-challenging activity and compared results within each set of twins (meaning, compared the result for one twin to the result for their sibling). 2. For a test of hypotheses to compare two means based on independent samples, what happens to the likelihood of rejecting the null hypothesis for each actionlchange below, holding all other ideaslterms constant? a. Increase Your Tolerance for a Type I Error b. Decrease the Sample Sizes c. Increase the Values of the Sample Standard Deviations 3. A rm is considering the delivery times of two raw material suppliers, A and B. The rm is basically satised with supplier A; however, if the rm nds the mean delivery time of supplier B is less than the mean delivery time of supplier A, on average, the rm will begin purchasing raw materials from suppler B (meaning, switch from supplier A to supplier B). Independent samples (assume equal population variances) show the following sample data for the delivery times of the two suppliers: SUPPLIER SUB'IMARY DATA A B Sample Mean 15 days 12 days Sample Standard Deviation 5 days 4 days Sample Size 61 41 a. State the null and alternative hypotheses for this situation. b. Describe what a Type [Error would be in this situation (please be as specific as possible). c. If on = 0.01, what is the critical value of the associated test statistic? d. What is the calculated value of the associated test statistic? e. State your decision about the null hypothesis by comparing the critical and calculated values of the test statistic (Parts c and d). 1'. What action do you recommend in terms of supplier selection? 4. To test whether companies that fail differ from companies that continue to operate, on average, the noted nancial markets expert, Susan Senbet (also known as the Silver Spring Sage), compared the current ratios for a random sample of companies that failed to the current ratios for a random sample of companies that are healthy and continue to operate (NOTE: current ratio = current assets + current liabilities). Use the table below, that Susan generated with MS Excel, to answerlcomplete Parts a through e: t-Test: Two-Sample ASSuming Unequal Variances HEALTHY FAILED Mean 1.7970 0.8218 Variance 0.496777 0.239625 Observations 23 22 Hypothesized Mean Difference 0 df 39 t Stat P[T
Step by Step Solution
There are 3 Steps involved in it
Step: 1
Get Instant Access to Expert-Tailored Solutions
See step-by-step solutions with expert insights and AI powered tools for academic success
Step: 2
Step: 3
Ace Your Homework with AI
Get the answers you need in no time with our AI-driven, step-by-step assistance