

Question
***BOLD WORDS are my answer for part a of the questions, please feel free to give me new suggestions on questions if needed!*** :) Part
***BOLD WORDS are my answer for part a of the questions, please feel free to give me new suggestions on questions if needed!*** :)
Part 1) Please create three survey questions. And make it so that one of the three survey questions could represent a dependent variable and one of the three could represent an independent variable. The next assignment question will ask you about the dependent and independent variables. For this current assignment question, please just create the three survey questions.
1) a survey question that would represent a nominal variable (and please show the response categories).
2) a survey question that would represent an ordinal variable (and please show the response categories).
3) a survey question that would represent an interval-ratio variable.
1. What college are you attending in North Dakota?
- North Dakota State University
- University of North Dakota
- Minot State University
- Bismarck State College
- Dickinson State University
- Mayville State University
- University of Mary
- Dakota College at Bottineau
- Valley City State University
- Other ________
2. What age are you attending college at now?
- 18-29
- 30-39
- 40-49
- 50-59
- 60 or older
3. How many calories do you eat in a day? _____
Part 2) Please answer the following questions in order, designated by the number so that I know that you are answering each question.
1. What is a dependent variable?
2. What is an independent variable?
3. Of your three survey questions, please identify the one that represents the dependent variable and explain why you chose that one in relation to the independent variable?
4. Of your three survey questions, please identify the one that represents the independent variable and explain why you chose that one in relation to the dependent variable?
Part 3) For this part of the assignment, please ask 10 people your three survey questions and fill in their answers. Your response categories to the nominal and ordinal variables will need to have numbers associated with them (e.g., what is your gender? 1) male; 2) female; 3) other) so that you can fill in a number and not a word/phrase following the recording system below. That is, respondent 1 will have a numeric answer for question 1, question 2, and question 3, and do the same for the other nine respondents.
Respondent Q1 Q2 Q3 1 2 3 4 5 6 7 8 9 10
Part 4) Your survey question three should be interval ratio. Please do the following.
1. Based on the data you collected from the 10 respondents for Q3, please calculate the average for Q3 and interpret the average.
2. Based on the data you collected from the 10 respondents for Q3, please calculate the standard deviation for Q3 and interpret the standard deviation. (The standard deviation formula can be found in the lectures, textbook, and exam review sheet).
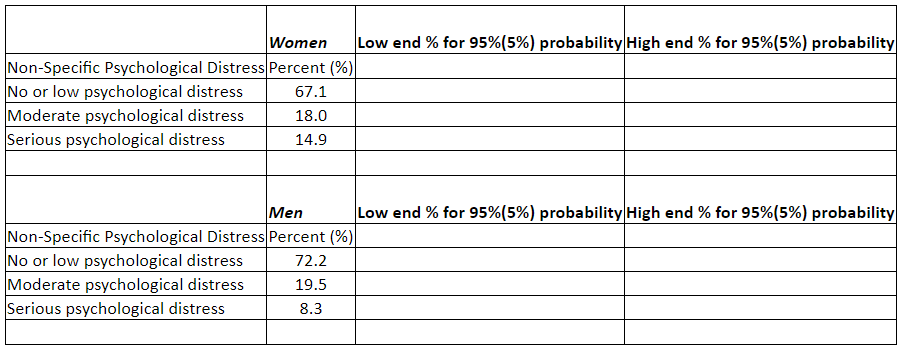
Part 5) This part of the assignment will ask you to calculate confidence intervals for the following two sets of data. You can find the formula from the lecture, textbook, and exam review sheet. (Notes: The data come from the Spring 2020 National College Health Assessment III for University of North Dakota; N=868 UND students). This part of the assignment requires a few tasks:
1. After calculating the confidence intervals, please provide answers that go out two digits after the decimal (e.g., 67.11%)
2. Please remember that the answers will also be in percentages and not proportions because we're trying to estimate percentages of the population of UND students, even though you calculate in portions, and put them into the cells that correspond with the categories (e.g., what percentage is below 67.1% for no or low psychological distress and what percentage is above it, which sets the confidence interval range?). Remember, the 67.1% is a point estimate and we want to know the confidence interval around it. So, because there are three categories for women and three categories for men, you will have six confidence intervals in total (which means you will have six percentages for the low end of the range and six percentages for the high end of the range). You can put all 12 percentages in the table.
3. Please pick one category for women and one category for men and interpret the confidence intervals for each of those categories.
Step by Step Solution
There are 3 Steps involved in it
Step: 1

Get Instant Access to Expert-Tailored Solutions
See step-by-step solutions with expert insights and AI powered tools for academic success
Step: 2

Step: 3
Ace Your Homework with AI
Get the answers you need in no time with our AI-driven, step-by-step assistance
Get Started
Discrete and Combinatorial Mathematics An Applied Introduction
Authors: Ralph P. Grimaldi
5th edition
201726343, 978-0201726343