

Answered step by step
Verified Expert Solution
Question
1 Approved Answer
Bottom part is HW1 C in Python please 3. (30 pts) Use the python function written in HW1 part (c) that accepts a list of
Bottom part is HW1 C
in Python please
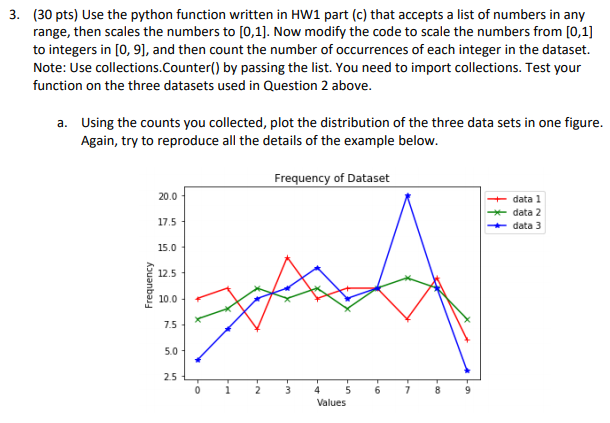
3. (30 pts) Use the python function written in HW1 part (c) that accepts a list of numbers in any range, then scales the numbers to [0,1]. Now modify the code to scale the numbers from [0,1) to integers in [0, 9], and then count the number of occurrences of each integer in the dataset. Note: Use collections.Counter() by passing the list. You need to import collections. Test your function on the three datasets used in Question 2 above. Using the counts you collected, plot the distribution of the three data sets in one figure. Again, try to reproduce all the details of the example below. a. Frequency of Dataset 20.0 17.5 15.0 12.5 10.0 7.5 5.0 2.5 data 1 data 2 data 3 ValuesStep by Step Solution
There are 3 Steps involved in it
Step: 1

Get Instant Access to Expert-Tailored Solutions
See step-by-step solutions with expert insights and AI powered tools for academic success
Step: 2

Step: 3
Ace Your Homework with AI
Get the answers you need in no time with our AI-driven, step-by-step assistance
Get Started
Pro Oracle Fusion Applications Installation And Administration
Authors: Tushar Thakker
1st Edition
1484209834, 9781484209837