Question
Complete ratio analysis for the years 2010 through 2014, calculating the following ratios Use the unaudited data for 2014. For any ratios that use an
Complete ratio analysis for the years 2010 through 2014, calculating the following ratios
Use the unaudited data for 2014. For any ratios that use an average of 2 years in the formula, you can assume that the 2010 ending balance approximates the 2010 average. (The ratios that use an average of 2 years in the formula include accounts receivable turnover, inventory turnover, return on assets, and return on equity.) You are not given the 2009 data to calculate the average for 2010, so you can assume that the average for 2010 is equal to the year-end balance. Show your calculations for each ratio or complete in Excel worksheet using formulas:
- Current ratio
- Receivables turnover
- Day’s sales in receivables
- Inventory turnover
- Inventory holding period
- Rate of return on net sales
- Rate of return on total assets
- Rate of return on stockholders’ equity
- Asset turnover
- EPS
- Debt ratio
- Times interest earned
- Provide a discussion of the company’s performance in terms of liquidity, profitability, and leverage. Be sure to discuss each ratio. In your discussion, identify the key indicators that showed the downfall of Forge Group.


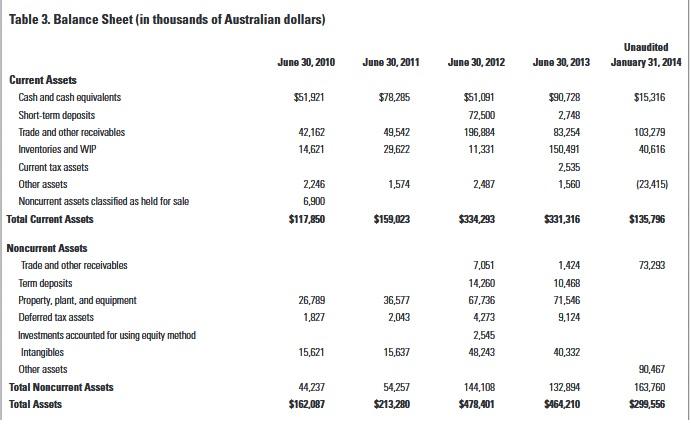
Table 3. Balance Sheet (in thousands of Australian dollars) Unaudited June 30, 2010 June 30, 2011 June 30, 2012 June 30, 2013 January 31, 2014 Current Assets Cash and cash oquivalents $51,921 $78,285 $51,091 F90,728 $15,316 Short-term deposits 72,500 2,748 Trade and other receivables 42,162 49,542 196,884 83,254 103,279 Inventories and WIP 14,621 29,622 11,331 150,491 40,616 Current tax assets 2,535 Other assets 2,246 1,574 2,487 1,560 (23,415) Noncurrent assets classifiad as held for sale 6,900 Total Current Assets $117,850 $159,023 $334,293 $331,316 $135,796 Noncurrent Assets Trade and other receivables 7,051 1,424 73,293 Term deposits 14,260 10,468 Property, plant, and equipment 26,789 36,577 67,736 71,546 Deferred tax assets 1,827 2,043 4,273 9,124 Inwestments accounted for using equity method 2,545 Intangibles 15,621 15,637 48,243 40,332 Other assets 90,467 Total Noncurrent Assets 44,237 54,257 144,108 132,894 163,760 Total Assets $162,087 $213,280 $478,401 $464,210 $299,556
Step by Step Solution
3.43 Rating (162 Votes )
There are 3 Steps involved in it
Step: 1

Get Instant Access to Expert-Tailored Solutions
See step-by-step solutions with expert insights and AI powered tools for academic success
Step: 2

Step: 3

Ace Your Homework with AI
Get the answers you need in no time with our AI-driven, step-by-step assistance
Get Started


