Question
Brand & Consumer Purchase Dynamics Analysis The base spreadsheet for your version of the exam contains information on the brand and
Brand & Consumer Purchase Dynamics Analysis
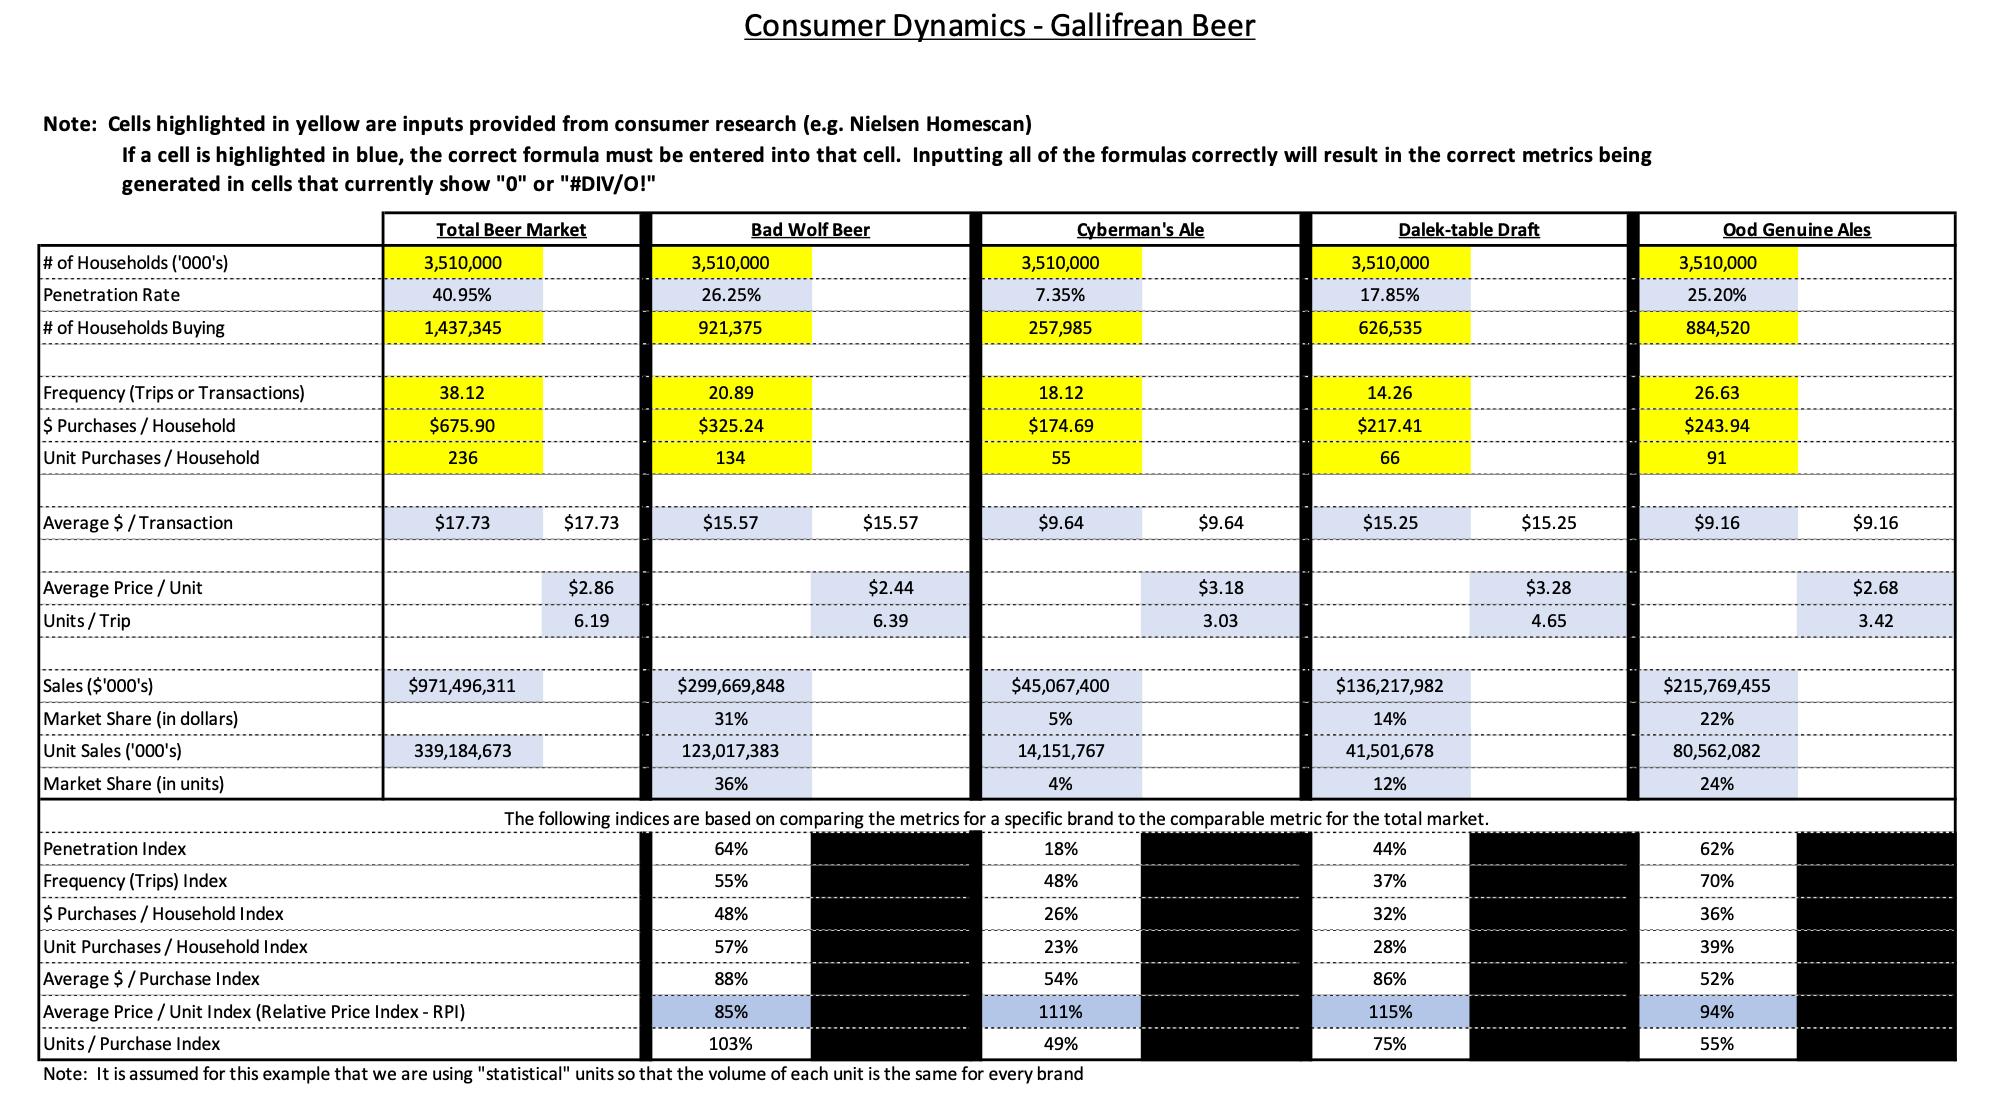
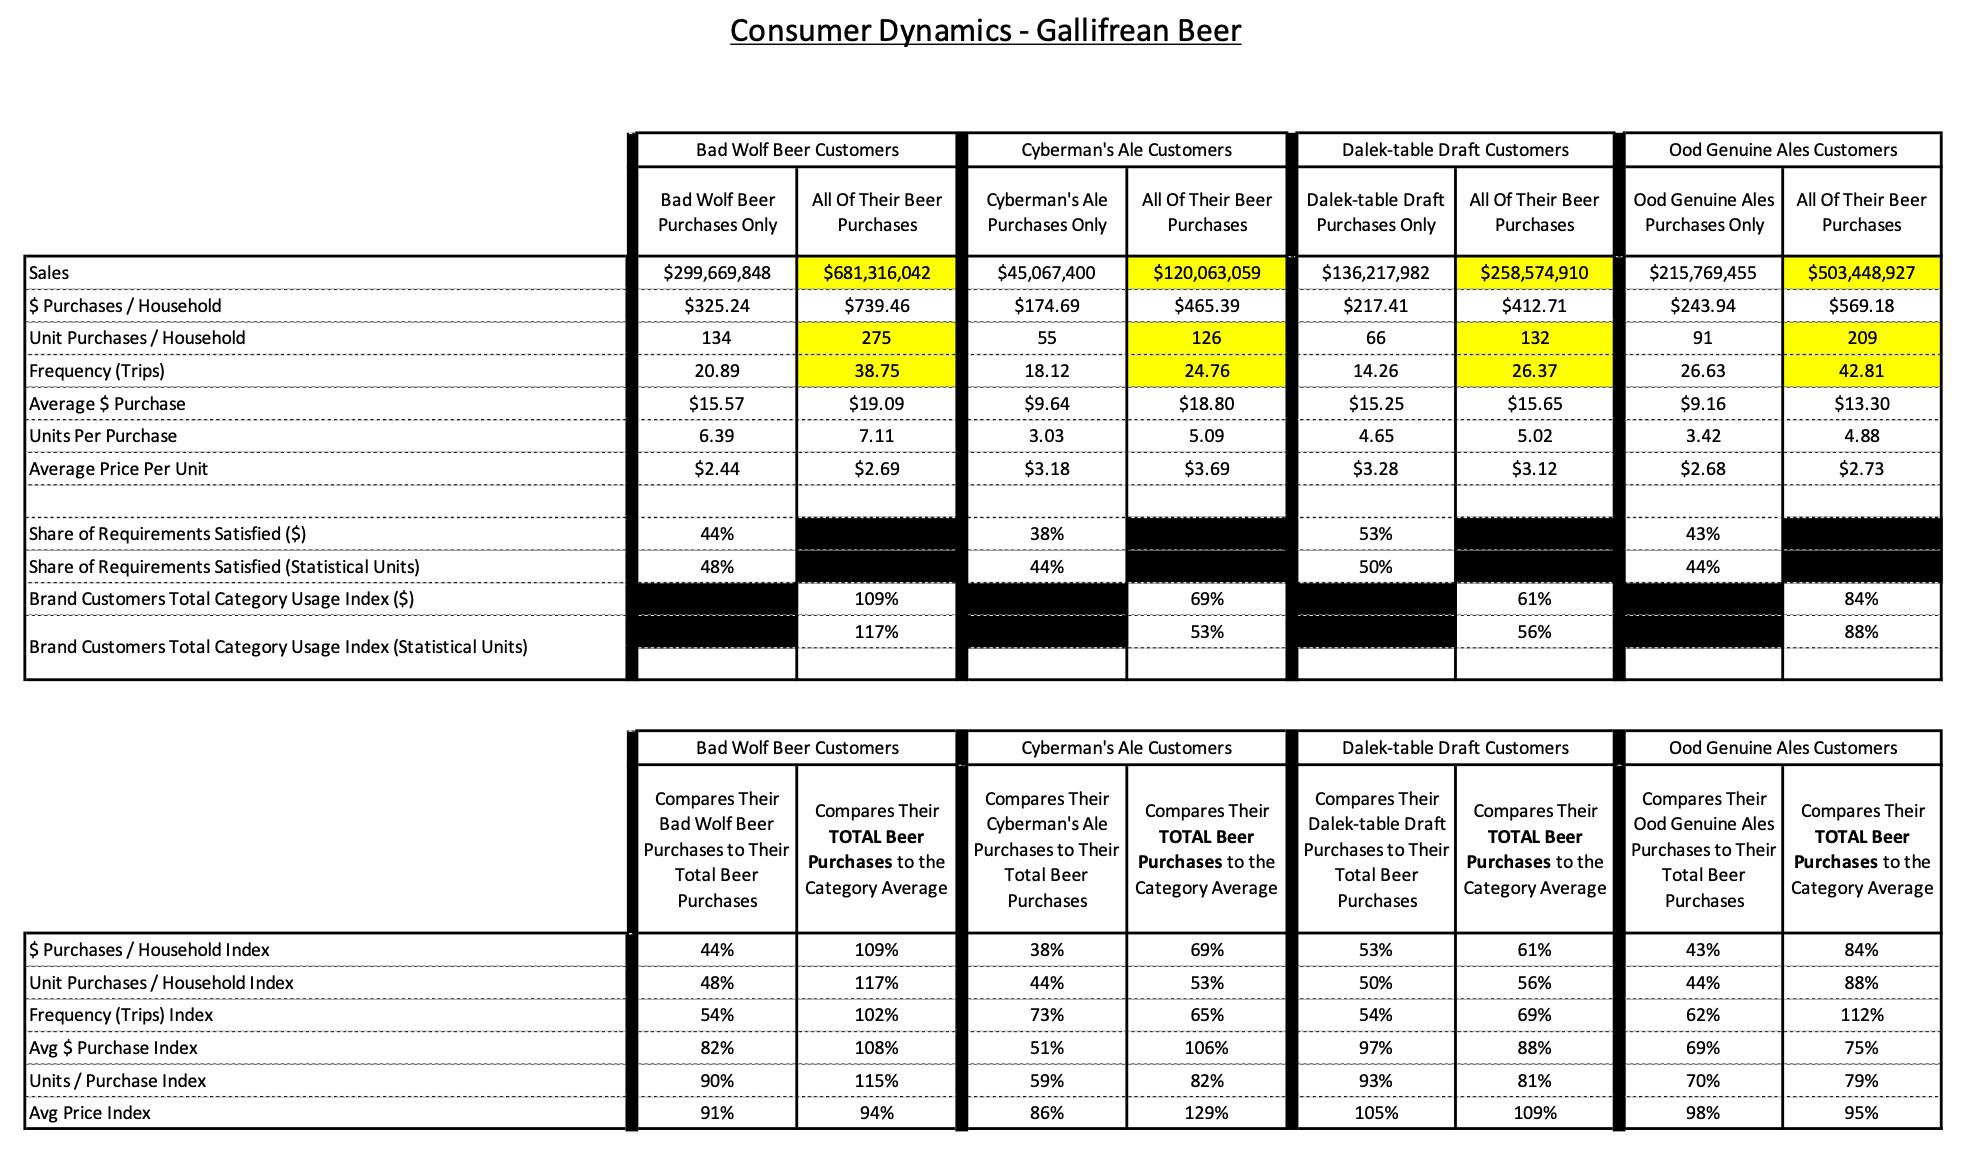
The base spreadsheet for your version of the exam contains information on the brand and consumer dynamics for the four major companies that participate in the Gallifrean Beer market. Information is provided for each brand showing the consumer purchase dynamics when only the named brand is purchased by its consumers and for all beer purchases by each brand's consumer base.
1. From your review of the market information and consumer dynamics in contained in your completed excel spreadsheet, provide four (4) insights about the Gallifrean beer market, its average consumer and its level of competitiveness. Remember that this question is about the overall market and the consumer NOT about individual brands.
2. Using the information contained in the entire "Gallifrean Beer - Base" spreadsheet for your version of the exam, what can you learn about Cyberman's Ale customers from analyzing their purchase behaviour for their TOTAL beer purchases and comparing them to the other three brands and the overall market? Please provide a minimum of four (4) insights and remember that to be relevant, metrics need to be compared to other metrics.
3. What can you learn about Cyberman's Ale customers from analyzing their purchase behaviour when they ONLY buy Cyberman's Ale and comparing it their buying behaviour for their TOTAL beer purchases and the buying behavior of consumers of the other three brands (for their brand and/or their total beer purchases) and buying behavior for the overall market? Please provide a minimum of four (4) insights and remember that to be relevant, metrics need to be compared to other metrics.
4. Based on the information in the spreadsheet and your analysis, what do you believe are the TWO biggest opportunities for Cyberman's Ale to improve their sales performance and why? Remember to appropriately justify your recommendation with relevant metrics and facts and to limit yourself to only two opportunities.
5. Quantify the annual increase in sales for each of the TWO biggest opportunities forCyberman's Ale that you identified. Ensure that you provide justification for the new objective for each of the two metrics that you have identified. Please show your calculations in this word document.


Consumer Dynamics - Gallifrean Beer Note: Cells highlighted in yellow are inputs provided from consumer research (e.g. Nielsen Homescan) If a cell is highlighted in blue, the correct formula must be entered into that cell. Inputting all of the formulas correctly will result in the correct metrics being generated in cells that currently show "0" or "#DIV/O!" Total Beer Market # of Households ('000's) Penetration Rate # of Households Buying Frequency (Trips or Transactions) $ Purchases/Household Unit Purchases/ Household 3,510,000 40.95% 1,437,345 38.12 $675.90 236 Bad Wolf Beer 3,510,000 26.25% 921,375 20.89 $325.24 134 Cyberman's Ale 3,510,000 7.35% 257,985 18.12 $174.69 55 Dalek-table Draft 3,510,000 17.85% 626,535 14.26 $217.41 66 Ood Genuine Ales 3,510,000 25.20% 884,520 26.63 $243.94 91 Average $/Transaction $17.73 $17.73 $15.57 $15.57 $9.64 $9.64 $15.25 $15.25 $9.16 $9.16 Average Price/ Unit Units/Trip $2.86 6.19 $2.44 6.39 $3.18 3.03 $3.28 4.65 $2.68 3.42 Sales ($'000's) $971,496,311 Market Share (in dollars) Unit Sales ('000's) 339,184,673 Market Share (in units) $299,669,848 31% 123,017,383 36% $45,067,400 5% $136,217,982 14% $215,769,455 22% 14,151,767 4% 41,501,678 80,562,082 12% 24% The following indices are based on comparing the metrics for a specific brand to the comparable metric for the total market. Penetration Index 64% 18% 44% 62% Frequency (Trips) Index $ Purchases/Household Index Unit Purchases / Household Index Average $/Purchase Index 55% 48% 37% 70% 48% 26% 32% 36% 57% 23% 28% 39% 88% 54% 86% 52% Average Price / Unit Index (Relative Price Index - RPI) 85% 111% 115% 94% Units/Purchase Index 103% 49% 75% 55% Note: It is assumed for this example that we are using "statistical" units so that the volume of each unit is the same for every brand
Step by Step Solution
There are 3 Steps involved in it
Step: 1

Get Instant Access to Expert-Tailored Solutions
See step-by-step solutions with expert insights and AI powered tools for academic success
Step: 2

Step: 3

Ace Your Homework with AI
Get the answers you need in no time with our AI-driven, step-by-step assistance
Get Started


