

Answered step by step
Verified Expert Solution
Question
1 Approved Answer
Break-even analysis 1) In the space below, draw & label a graph showing the following: - X axis = Output, Y axis = Costs /
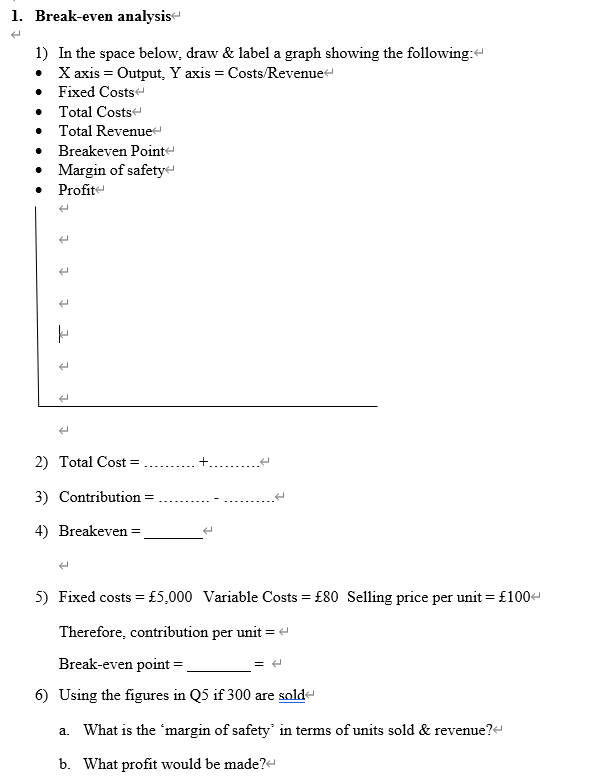 Break-even analysis 1) In the space below, draw \& label a graph showing the following: - X axis = Output, Y axis = Costs / Revenue - Fixed Costs - Total Costs - Total Revenue - Breakeven Point - Margin of safety - Profit 2) Total Cost = + . 3) Contribution = 4) Breakeven = 5) Fixed costs =5,000 Variable Costs =80 Selling price per unit =100 Therefore, contribution per unit = Break-even point = = 6) Using the figures in Q5 if 300 are sold a. What is the 'margin of safety' in terms of units sold \& revenue? b. What profit would be made? Break-even analysis 1) In the space below, draw \& label a graph showing the following: - X axis = Output, Y axis = Costs / Revenue - Fixed Costs - Total Costs - Total Revenue - Breakeven Point - Margin of safety - Profit 2) Total Cost = + . 3) Contribution = 4) Breakeven = 5) Fixed costs =5,000 Variable Costs =80 Selling price per unit =100 Therefore, contribution per unit = Break-even point = = 6) Using the figures in Q5 if 300 are sold a. What is the 'margin of safety' in terms of units sold \& revenue? b. What profit would be made
 Step by Step Solution
There are 3 Steps involved in it
Step: 1

Get Instant Access to Expert-Tailored Solutions
See step-by-step solutions with expert insights and AI powered tools for academic success
Step: 2

Step: 3
Ace Your Homework with AI
Get the answers you need in no time with our AI-driven, step-by-step assistance
Get Started
Modern Auditing And Assurance Services
Authors: Philomena Leung, Paul Coram, Barry J. Cooper, Peter Richardson
6th Edition
1118615247, 9781118615249