

Answered step by step
Verified Expert Solution
Question
1 Approved Answer
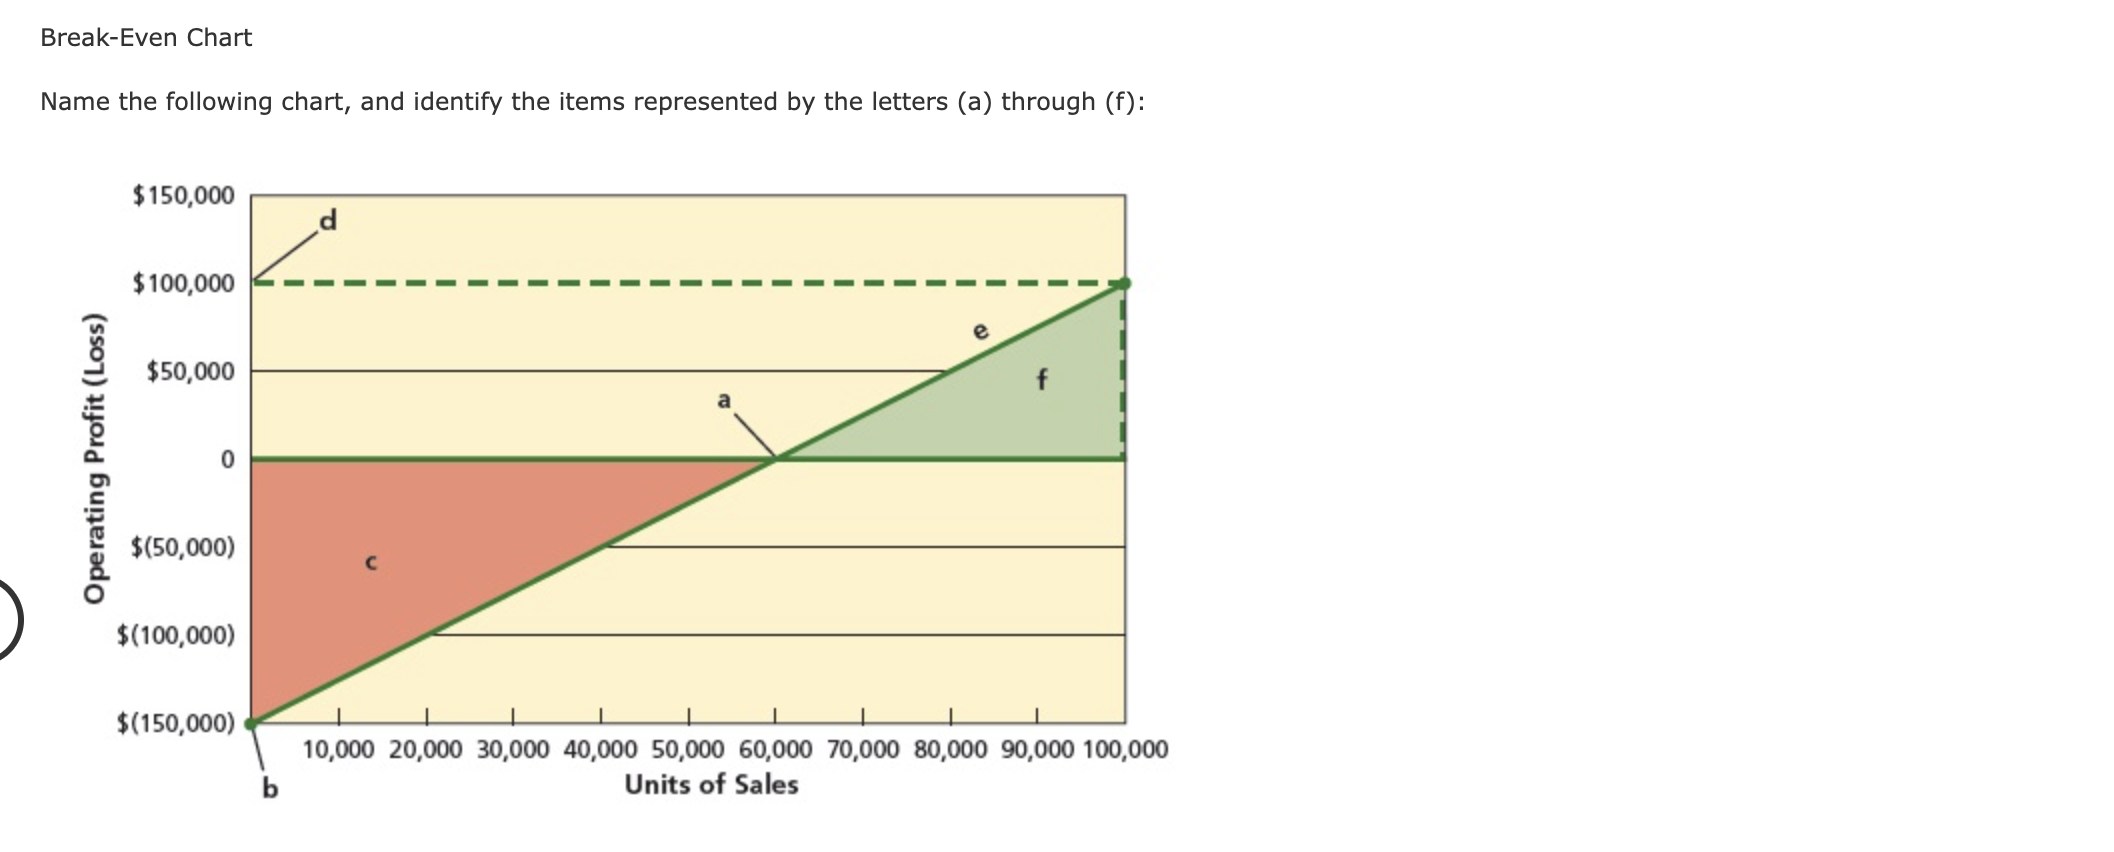
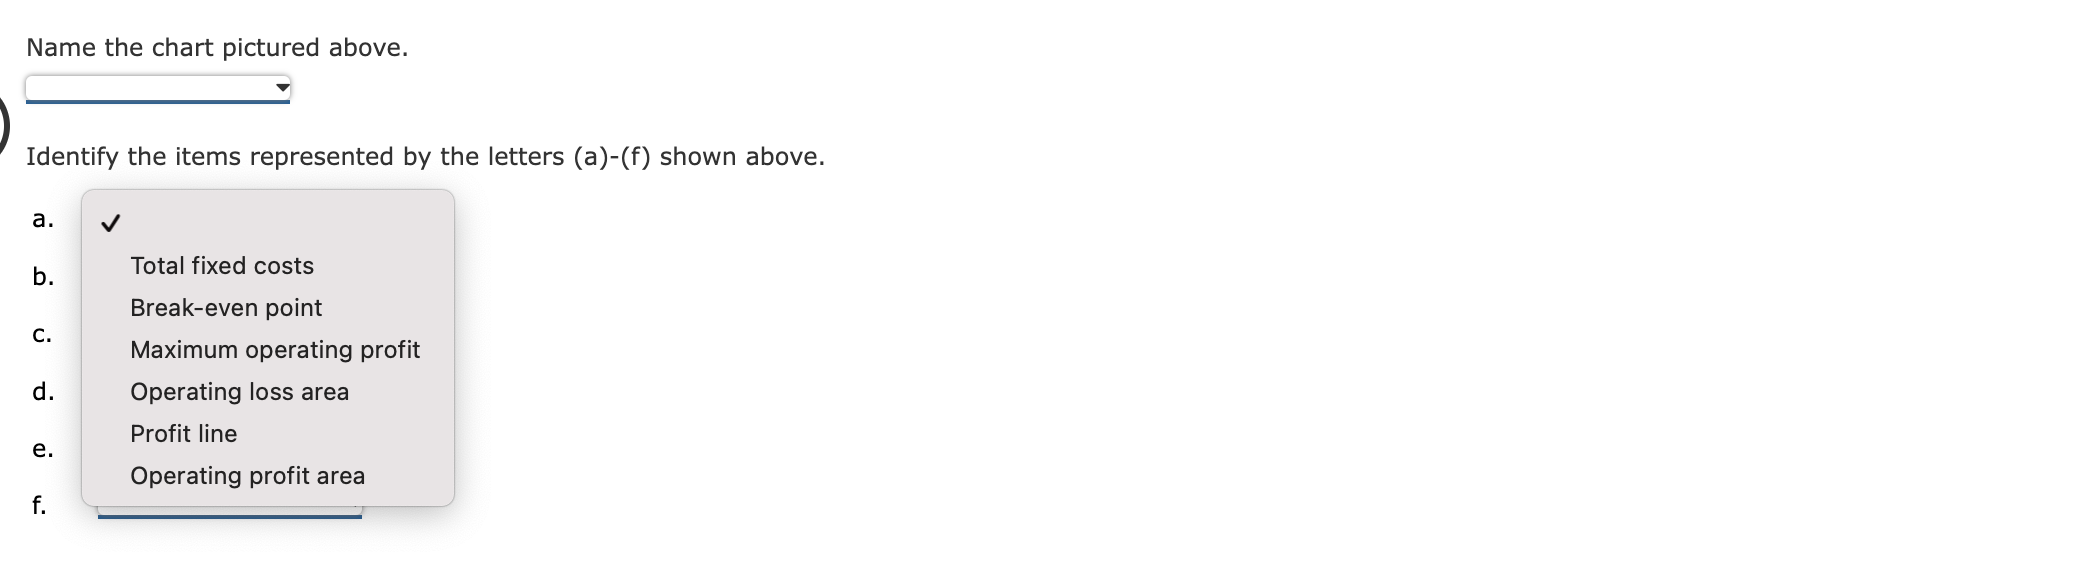
Break-Even Chart Name the following chart, and identify the items represented by the letters (a) through (f): $150,000 d $100,000 $50,000 f 0 $(50,000) $(100,000)
Step by Step Solution
There are 3 Steps involved in it
Step: 1

Get Instant Access to Expert-Tailored Solutions
See step-by-step solutions with expert insights and AI powered tools for academic success
Step: 2

Step: 3
Ace Your Homework with AI
Get the answers you need in no time with our AI-driven, step-by-step assistance
Get Started
Energy And Finance Sustainability In The Energy Industry
Authors: André Dorsman, Özgür Arslan-Ayaydin, Mehmet Baha Karan
1st Edition
3319322664, 978-3319322667