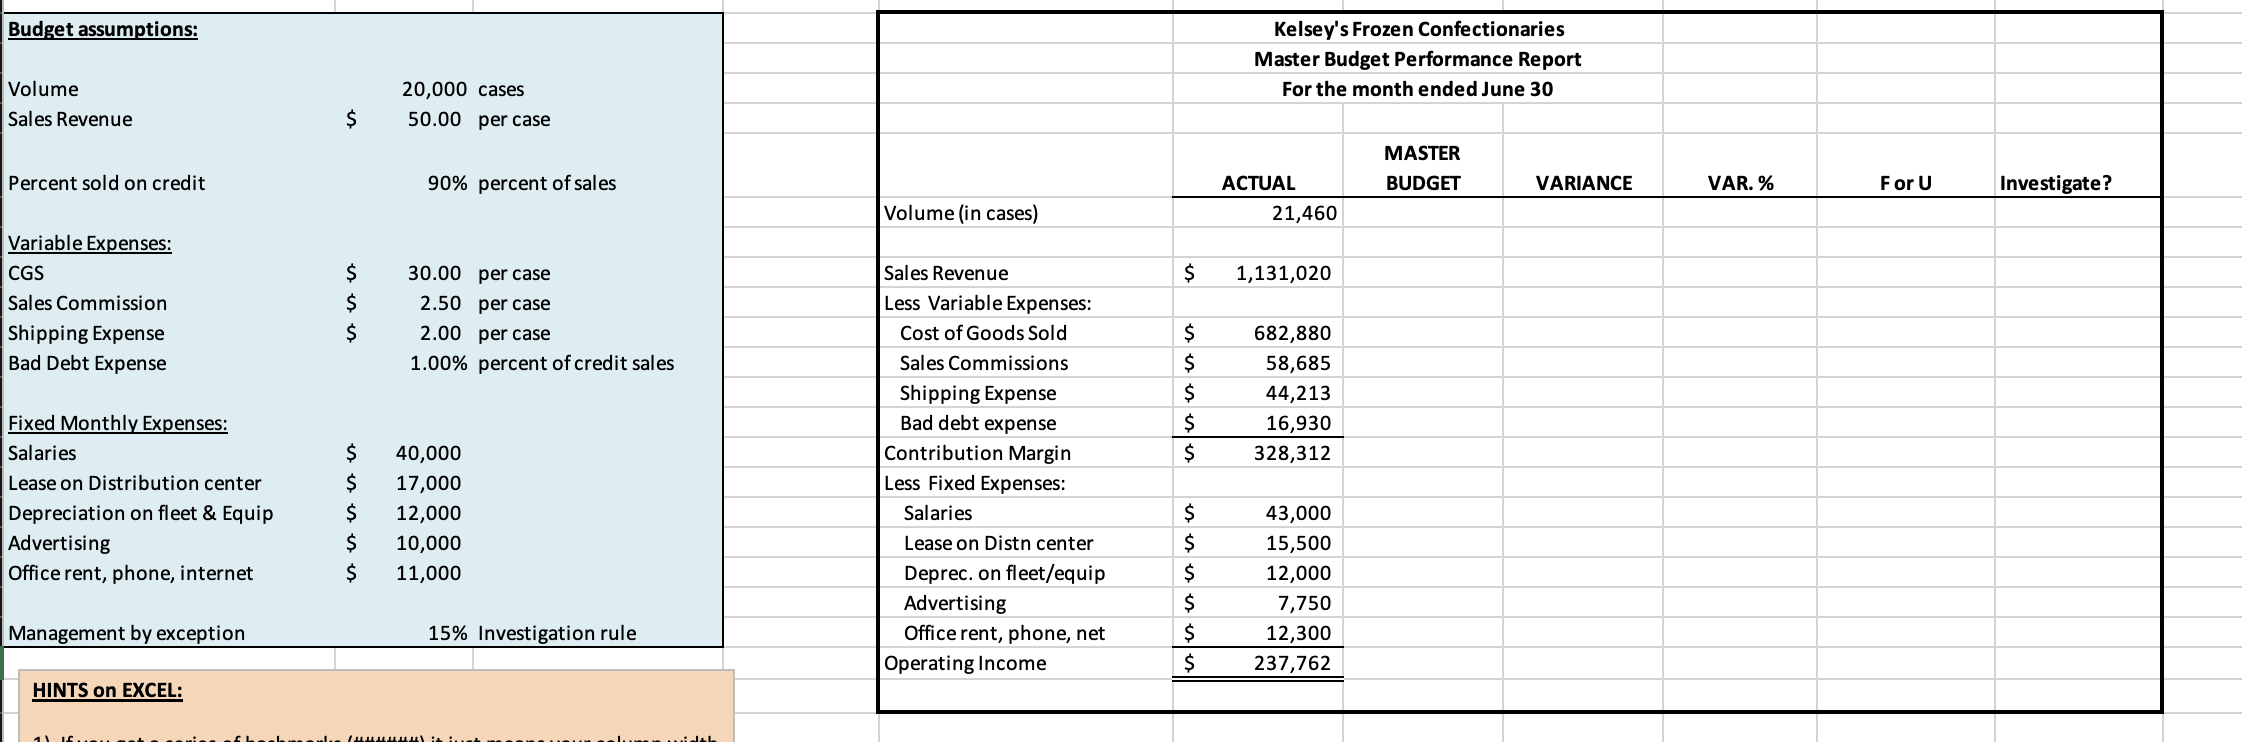
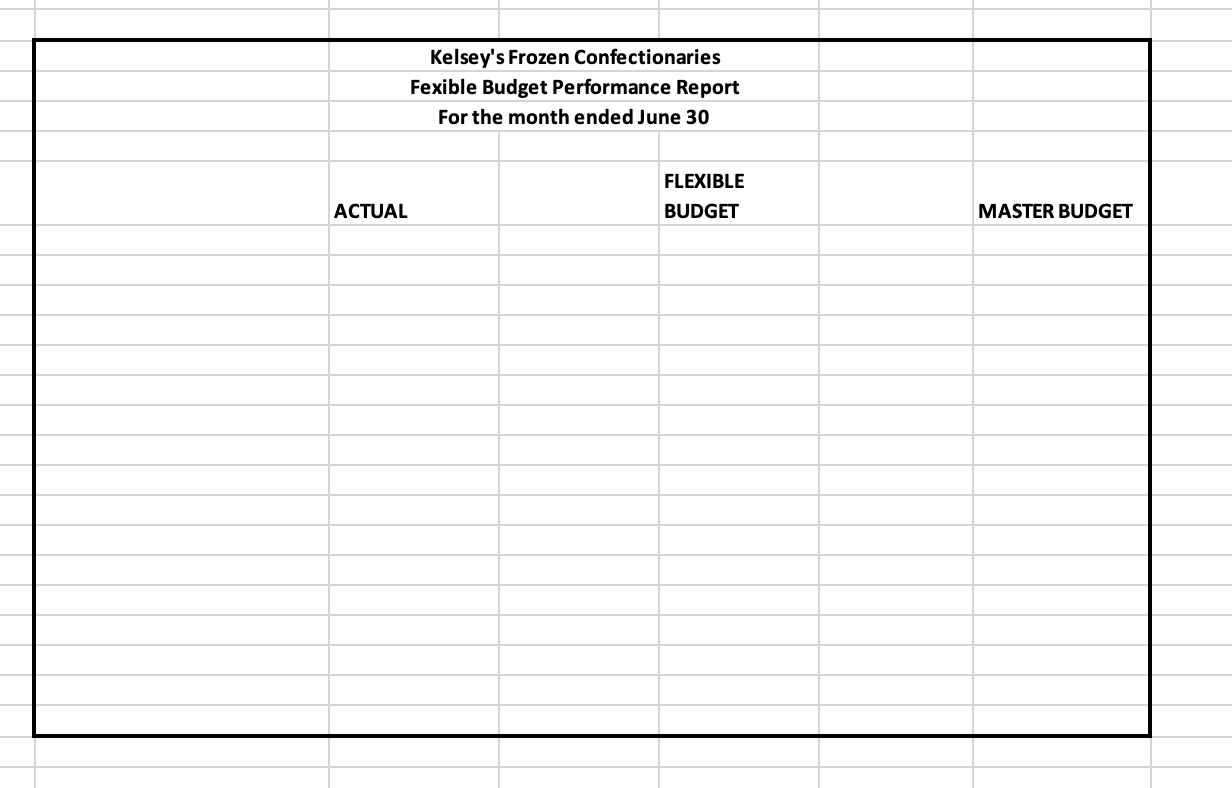
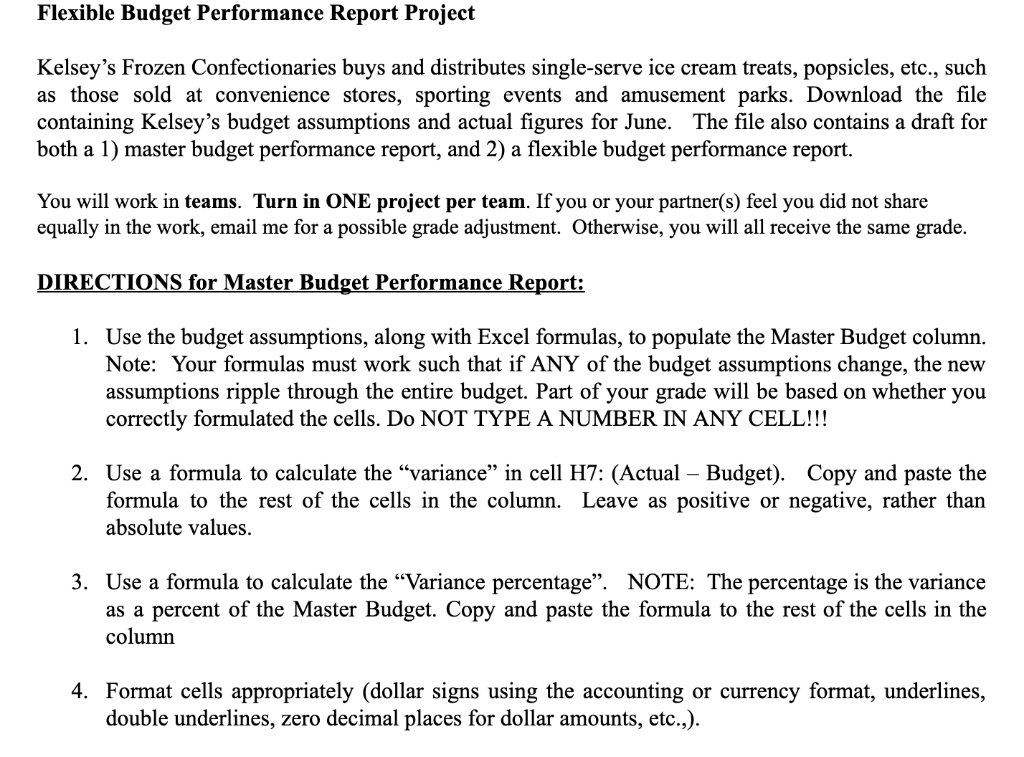
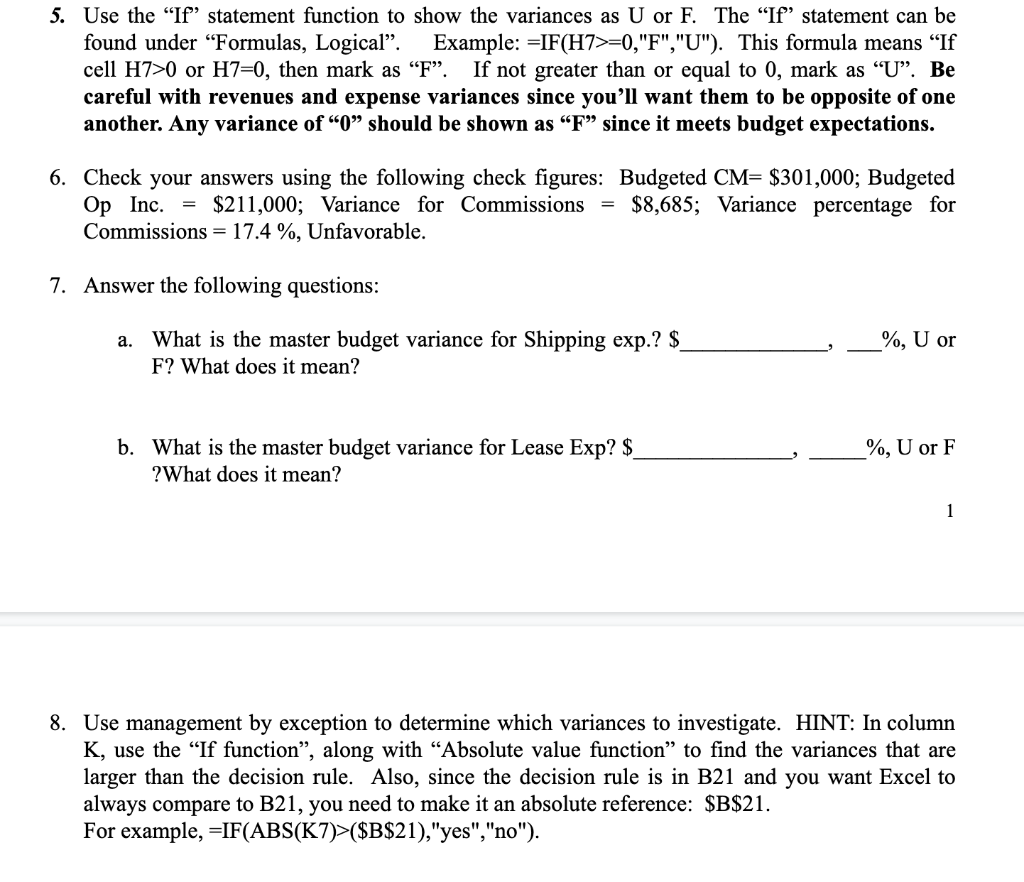
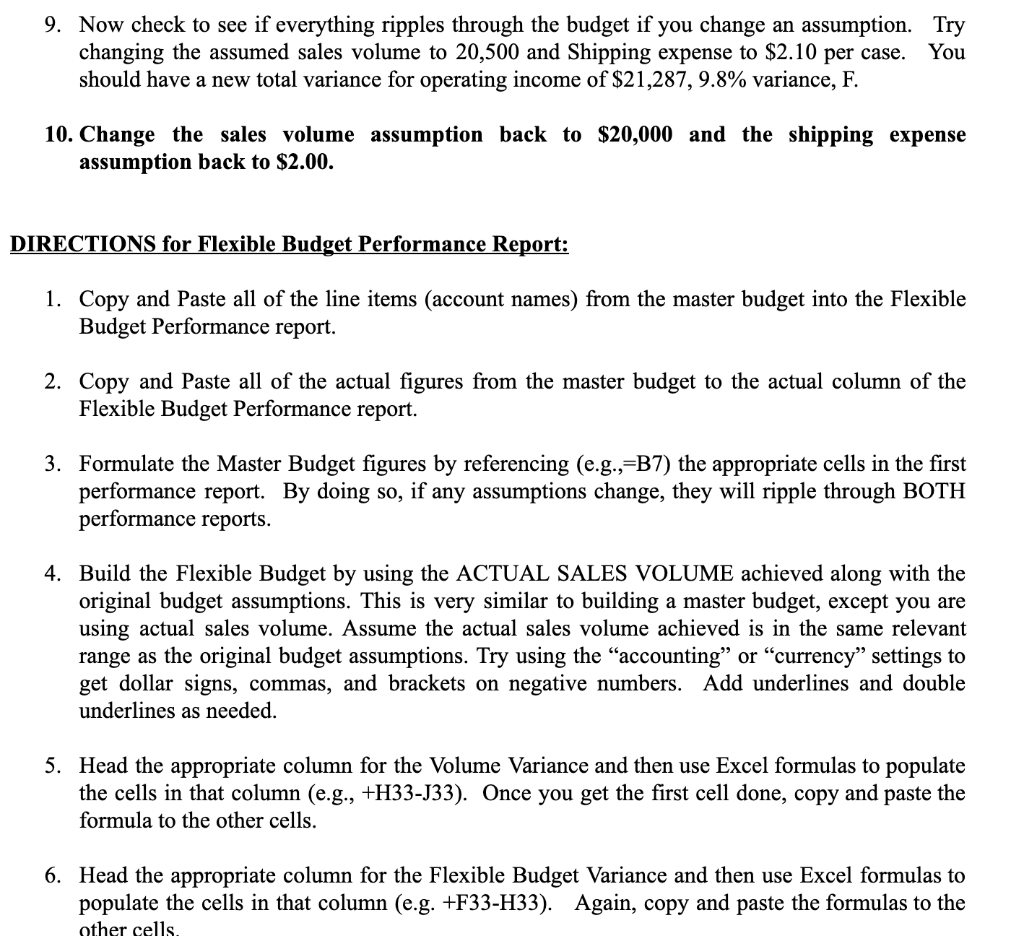
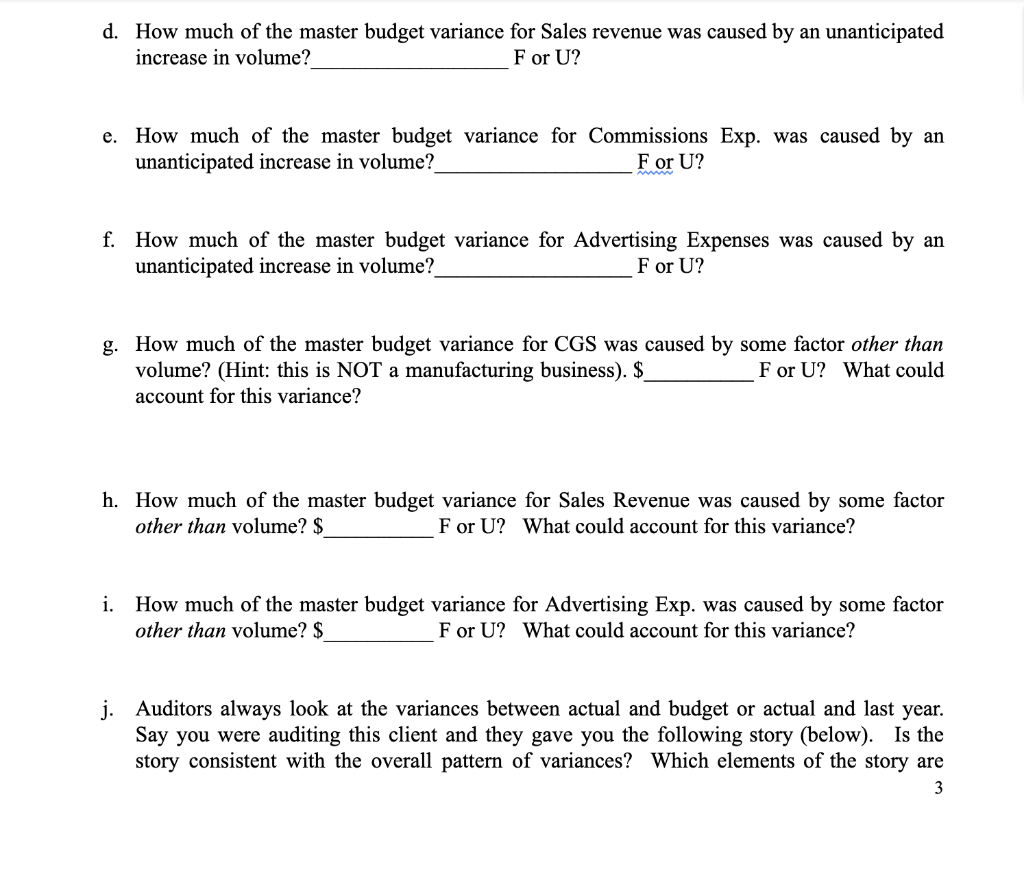
Budget assumptions: Kelsey's Frozen Confectionaries Master Budget Performance Report For the month ended June 30 Volume Sales Revenue 20,000 cases 50.00 per case $ MASTER Percent sold on credit 90% percent of sales BUDGET VARIANCE VAR. % For U Investigate? ACTUAL 21,460 Volume (in cases) $ 1,131,020 Variable Expenses: CGS Sales Commission Shipping Expense Bad Debt Expense $ $ $ 30.00 per case 2.50 per case 2.00 per case 1.00% percent of credit sales $ $ $ $ $ 682,880 58,685 44,213 16,930 328,312 Fixed Monthly Expenses: Salaries Lease on Distribution center Depreciation on fleet & Equip Advertising Office rent, phone, internet $ $ $ $ $ 40,000 17,000 12,000 10,000 11,000 Sales Revenue Less Variable Expenses: Cost of Goods Sold Sales Commissions Shipping Expense Bad debt expense Contribution Margin Less Fixed Expenses: Salaries Lease on Distn center Deprec. on fleet/equip Advertising Office rent, phone, net Operating Income $ $ $ $ $ $ 43,000 15,500 12,000 7,750 12,300 237,762 Management by exception 15% Investigation rule HINTS on EXCEL: huuuuuu Kelsey's Frozen Confectionaries Fexible Budget Performance Report For the month ended June 30 FLEXIBLE BUDGET ACTUAL MASTER BUDGET Flexible Budget Performance Report Project Kelsey's Frozen Confectionaries buys and distributes single-serve ice cream treats, popsicles, etc., such as those sold at convenience stores, sporting events and amusement parks. Download the file containing Kelsey's budget assumptions and actual figures for June. The file also contains a draft for both a 1) master budget performance report, and 2) a flexible budget performance report. You will work in teams. Turn in ONE project per team. If you or your partner(s) feel you did not share equally in the work, email me for a possible grade adjustment. Otherwise, you will all receive the same grade. DIRECTIONS for Master Budget Performance Report: 1. Use the budget assumptions, along with Excel formulas, to populate the Master Budget column. Note: Your formulas must work such that if ANY of the budget assumptions change, the new assumptions ripple through the entire budget. Part of your grade will be based on whether you correctly formulated the cells. Do NOT TYPE A NUMBER IN ANY CELL!!! 2. Use a formula to calculate the variance in cell H7: (Actual Budget). Copy and paste the formula to the rest of the cells in the column. Leave as positive or negative, rather than absolute values. 3. Use a formula to calculate the "Variance percentage. NOTE: The percentage is the variance as a percent of the Master Budget. Copy and paste the formula to the rest of the cells in the column 4. Format cells appropriately (dollar signs using the accounting or currency format, underlines, double underlines, zero decimal places for dollar amounts, etc.,). 5. Use the If" statement function to show the variances as U or F. The "If" statement can be found under "Formulas, Logical. Example: =IF(H7>=0,"F","U"). This formula means If cell H7>0 or H7=0, then mark as F. If not greater than or equal to 0, mark as U. Be careful with revenues and expense variances since you'll want them to be opposite of one another. Any variance of O should be shown as F since it meets budget expectations. 6. Check your answers using the following check figures: Budgeted CM= $301,000; Budgeted Op Inc. = $211,000; Variance for Commissions = $8,685; Variance percentage for Commissions = 17.4 %, Unfavorable. 7. Answer the following questions: a. %, U or What is the master budget variance for Shipping exp.? $_ F? What does it mean? b. What is the master budget variance for Lease Exp? $_ ?What does it mean? %, U or F 1 8. Use management by exception to determine which variances to investigate. HINT: In column K, use the If function, along with Absolute value function to find the variances that are larger than the decision rule. Also, since the decision rule is in B21 and you want Excel to always compare to B21, you need to make it an absolute reference: $B$21. For example, =IF(ABS(K7)>($B$21),"yes","no"). 9. Now check to see if everything ripples through the budget if you change an assumption. Try changing the assumed sales volume to 20,500 and Shipping expense to $2.10 per case. You should have a new total variance for operating income of $21,287,9.8% variance, F. 10. Change the sales volume assumption back to $20,000 and the shipping expense assumption back to $2.00. DIRECTIONS for Flexible Budget Performance Report: 1. Copy and paste all of the line items (account names) from the master budget into the Flexible Budget Performance report. 2. Copy and Paste all of the actual figures from the master budget to the actual column of the Flexible Budget Performance report. 3. Formulate the Master Budget figures by referencing (e.g.,=B7) the appropriate cells in the first performance report. By doing so, if any assumptions change, they will ripple through BOTH performance reports. 4. Build the Flexible Budget by using the ACTUAL SALES VOLUME achieved along with the original budget assumptions. This is very similar to building a master budget, except you are using actual sales volume. Assume the actual sales volume achieved is in the same relevant range as the original budget assumptions. Try using the accounting or currency settings to get dollar signs, commas, and brackets on negative numbers. Add underlines and double underlines as needed. 5. Head the appropriate column for the Volume Variance and then use Excel formulas to populate the cells in that column (e.g., +H33-133). Once you get the first cell done, copy and paste the formula to the other cells. 6. Head the appropriate column for the Flexible Budget Variance and then use Excel formulas to populate the cells in that column (e.g. +F33-H33). Again, copy and paste the formulas to the other cells. d. How much of the master budget variance for Sales revenue was caused by an unanticipated increase in volume? For U? e. How much of the master budget variance for Commissions Exp. was caused by an unanticipated increase in volume? For U? f. How much of the master budget variance for Advertising Expenses was caused by an unanticipated increase in volume? For U? g. How much of the master budget variance for CGS was caused by some factor other than volume? (Hint: this is NOT a manufacturing business). $ For U? What could account for this variance? h. How much of the master budget variance for Sales Revenue was caused by some factor other than volume? $ For U? What could account for this variance? i. How much of the master budget variance for Advertising Exp. was caused by some factor other than volume? $ For U? What could account for this variance? j. Auditors always look at the variances between actual and budget or actual and last year. Say you were auditing this client and they gave you the following story (below). Is the story consistent with the overall pattern of variances? Which elements of the story are 3 Budget assumptions: Kelsey's Frozen Confectionaries Master Budget Performance Report For the month ended June 30 Volume Sales Revenue 20,000 cases 50.00 per case $ MASTER Percent sold on credit 90% percent of sales BUDGET VARIANCE VAR. % For U Investigate? ACTUAL 21,460 Volume (in cases) $ 1,131,020 Variable Expenses: CGS Sales Commission Shipping Expense Bad Debt Expense $ $ $ 30.00 per case 2.50 per case 2.00 per case 1.00% percent of credit sales $ $ $ $ $ 682,880 58,685 44,213 16,930 328,312 Fixed Monthly Expenses: Salaries Lease on Distribution center Depreciation on fleet & Equip Advertising Office rent, phone, internet $ $ $ $ $ 40,000 17,000 12,000 10,000 11,000 Sales Revenue Less Variable Expenses: Cost of Goods Sold Sales Commissions Shipping Expense Bad debt expense Contribution Margin Less Fixed Expenses: Salaries Lease on Distn center Deprec. on fleet/equip Advertising Office rent, phone, net Operating Income $ $ $ $ $ $ 43,000 15,500 12,000 7,750 12,300 237,762 Management by exception 15% Investigation rule HINTS on EXCEL: huuuuuu Kelsey's Frozen Confectionaries Fexible Budget Performance Report For the month ended June 30 FLEXIBLE BUDGET ACTUAL MASTER BUDGET Flexible Budget Performance Report Project Kelsey's Frozen Confectionaries buys and distributes single-serve ice cream treats, popsicles, etc., such as those sold at convenience stores, sporting events and amusement parks. Download the file containing Kelsey's budget assumptions and actual figures for June. The file also contains a draft for both a 1) master budget performance report, and 2) a flexible budget performance report. You will work in teams. Turn in ONE project per team. If you or your partner(s) feel you did not share equally in the work, email me for a possible grade adjustment. Otherwise, you will all receive the same grade. DIRECTIONS for Master Budget Performance Report: 1. Use the budget assumptions, along with Excel formulas, to populate the Master Budget column. Note: Your formulas must work such that if ANY of the budget assumptions change, the new assumptions ripple through the entire budget. Part of your grade will be based on whether you correctly formulated the cells. Do NOT TYPE A NUMBER IN ANY CELL!!! 2. Use a formula to calculate the variance in cell H7: (Actual Budget). Copy and paste the formula to the rest of the cells in the column. Leave as positive or negative, rather than absolute values. 3. Use a formula to calculate the "Variance percentage. NOTE: The percentage is the variance as a percent of the Master Budget. Copy and paste the formula to the rest of the cells in the column 4. Format cells appropriately (dollar signs using the accounting or currency format, underlines, double underlines, zero decimal places for dollar amounts, etc.,). 5. Use the If" statement function to show the variances as U or F. The "If" statement can be found under "Formulas, Logical. Example: =IF(H7>=0,"F","U"). This formula means If cell H7>0 or H7=0, then mark as F. If not greater than or equal to 0, mark as U. Be careful with revenues and expense variances since you'll want them to be opposite of one another. Any variance of O should be shown as F since it meets budget expectations. 6. Check your answers using the following check figures: Budgeted CM= $301,000; Budgeted Op Inc. = $211,000; Variance for Commissions = $8,685; Variance percentage for Commissions = 17.4 %, Unfavorable. 7. Answer the following questions: a. %, U or What is the master budget variance for Shipping exp.? $_ F? What does it mean? b. What is the master budget variance for Lease Exp? $_ ?What does it mean? %, U or F 1 8. Use management by exception to determine which variances to investigate. HINT: In column K, use the If function, along with Absolute value function to find the variances that are larger than the decision rule. Also, since the decision rule is in B21 and you want Excel to always compare to B21, you need to make it an absolute reference: $B$21. For example, =IF(ABS(K7)>($B$21),"yes","no"). 9. Now check to see if everything ripples through the budget if you change an assumption. Try changing the assumed sales volume to 20,500 and Shipping expense to $2.10 per case. You should have a new total variance for operating income of $21,287,9.8% variance, F. 10. Change the sales volume assumption back to $20,000 and the shipping expense assumption back to $2.00. DIRECTIONS for Flexible Budget Performance Report: 1. Copy and paste all of the line items (account names) from the master budget into the Flexible Budget Performance report. 2. Copy and Paste all of the actual figures from the master budget to the actual column of the Flexible Budget Performance report. 3. Formulate the Master Budget figures by referencing (e.g.,=B7) the appropriate cells in the first performance report. By doing so, if any assumptions change, they will ripple through BOTH performance reports. 4. Build the Flexible Budget by using the ACTUAL SALES VOLUME achieved along with the original budget assumptions. This is very similar to building a master budget, except you are using actual sales volume. Assume the actual sales volume achieved is in the same relevant range as the original budget assumptions. Try using the accounting or currency settings to get dollar signs, commas, and brackets on negative numbers. Add underlines and double underlines as needed. 5. Head the appropriate column for the Volume Variance and then use Excel formulas to populate the cells in that column (e.g., +H33-133). Once you get the first cell done, copy and paste the formula to the other cells. 6. Head the appropriate column for the Flexible Budget Variance and then use Excel formulas to populate the cells in that column (e.g. +F33-H33). Again, copy and paste the formulas to the other cells. d. How much of the master budget variance for Sales revenue was caused by an unanticipated increase in volume? For U? e. How much of the master budget variance for Commissions Exp. was caused by an unanticipated increase in volume? For U? f. How much of the master budget variance for Advertising Expenses was caused by an unanticipated increase in volume? For U? g. How much of the master budget variance for CGS was caused by some factor other than volume? (Hint: this is NOT a manufacturing business). $ For U? What could account for this variance? h. How much of the master budget variance for Sales Revenue was caused by some factor other than volume? $ For U? What could account for this variance? i. How much of the master budget variance for Advertising Exp. was caused by some factor other than volume? $ For U? What could account for this variance? j. Auditors always look at the variances between actual and budget or actual and last year. Say you were auditing this client and they gave you the following story (below). Is the story consistent with the overall pattern of variances? Which elements of the story are 3