Answered step by step
Verified Expert Solution
Question
1 Approved Answer
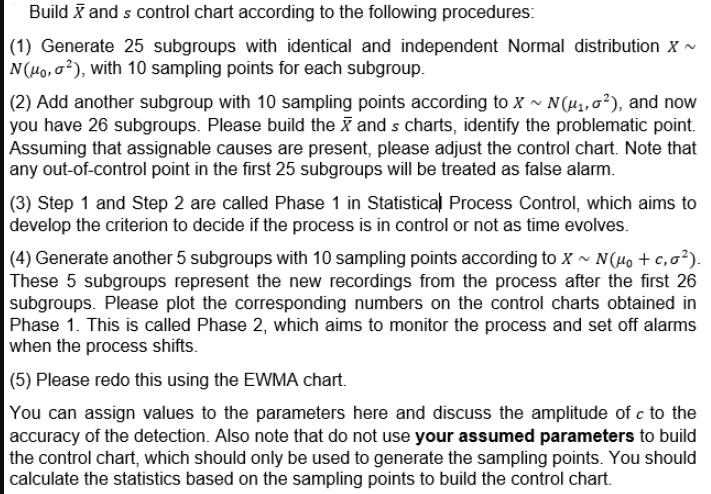
Build X and s control chart according to the following procedures: (1) Generate 25 subgroups with identical and independent Normal distribution X ~ N(Mo,

Build X and s control chart according to the following procedures: (1) Generate 25 subgroups with identical and independent Normal distribution X ~ N(Mo, 2), with 10 sampling points for each subgroup. (2) Add another subgroup with 10 sampling points according to X~ N(,0), and now you have 26 subgroups. Please build the X and s charts, identify the problematic point. Assuming that assignable causes are present, please adjust the control chart. Note that any out-of-control point in the first 25 subgroups will be treated as false alarm. (3) Step 1 and Step 2 are called Phase 1 in Statistical Process Control, which aims to develop the criterion to decide if the process is in control or not as time evolves. (4) Generate another 5 subgroups with 10 sampling points according to X~ N(o + c0). These 5 subgroups represent the new recordings from the process after the first 26 subgroups. Please plot the corresponding numbers on the control charts obtained in Phase 1. This is called Phase 2, which aims to monitor the process and set off alarms when the process shifts. (5) Please redo this using the EWMA chart. You can assign values to the parameters here and discuss the amplitude of c to the accuracy of the detection. Also note that do not use your assumed parameters to build the control chart, which should only be used to generate the sampling points. You should calculate the statistics based on the sampling points to build the control chart.
Step by Step Solution
★★★★★
3.41 Rating (151 Votes )
There are 3 Steps involved in it
Step: 1
Creating control charts as you described involves multiple steps each of which needs to be carried o...
Get Instant Access to Expert-Tailored Solutions
See step-by-step solutions with expert insights and AI powered tools for academic success
Step: 2

Step: 3

Ace Your Homework with AI
Get the answers you need in no time with our AI-driven, step-by-step assistance
Get Started


