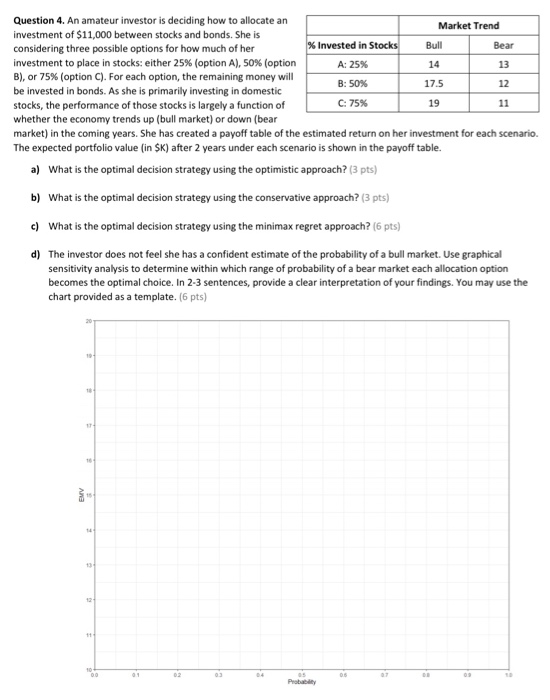
Bull Question 4. An amateur investor is deciding how to allocate an Market Trend investment of $11,000 between stocks and bonds. She is considering three possible options for how much of her % Invested in Stocks Bear investment to place in stocks: either 25% (option A), 50% (option A: 25% 14 13 B), or 75% (option C). For each option, the remaining money will B: 50% 17.5 12 be invested in bonds. As she is primarily investing in domestic stocks, the performance of those stocks is largely a function of C: 75% 19 whether the economy trends up (bull market) or down (bear market) in the coming years. She has created a payoff table of the estimated return on her investment for each scenario. The expected portfolio value in SK) after 2 years under each scenario is shown in the payoff table. a) What is the optimal decision strategy using the optimistic approach? (3 pts) b) What is the optimal decision strategy using the conservative approach? (3 pts) c) What is the optimal decision strategy using the minimax regret approach? (6 pts) d) The investor does not feel she has a confident estimate of the probability of a bull market. Use graphical sensitivity analysis to determine within which range of probability of a bear market each allocation option becomes the optimal choice. In 2-3 sentences, provide a clear interpretation of your findings. You may use the chart provided as a template. (6 pts) BV Bull Question 4. An amateur investor is deciding how to allocate an Market Trend investment of $11,000 between stocks and bonds. She is considering three possible options for how much of her % Invested in Stocks Bear investment to place in stocks: either 25% (option A), 50% (option A: 25% 14 13 B), or 75% (option C). For each option, the remaining money will B: 50% 17.5 12 be invested in bonds. As she is primarily investing in domestic stocks, the performance of those stocks is largely a function of C: 75% 19 whether the economy trends up (bull market) or down (bear market) in the coming years. She has created a payoff table of the estimated return on her investment for each scenario. The expected portfolio value in SK) after 2 years under each scenario is shown in the payoff table. a) What is the optimal decision strategy using the optimistic approach? (3 pts) b) What is the optimal decision strategy using the conservative approach? (3 pts) c) What is the optimal decision strategy using the minimax regret approach? (6 pts) d) The investor does not feel she has a confident estimate of the probability of a bull market. Use graphical sensitivity analysis to determine within which range of probability of a bear market each allocation option becomes the optimal choice. In 2-3 sentences, provide a clear interpretation of your findings. You may use the chart provided as a template. (6 pts) BV