Answered step by step
Verified Expert Solution
Question
1 Approved Answer
BUNYAN'S SUPPLY PROJECTED BALANCE SHEET (000's) 19X1 Projected Sales Level: $ 6,170 - Net Profit After Tax: $ 93 (1.5%) 19X8 % 19X9 %
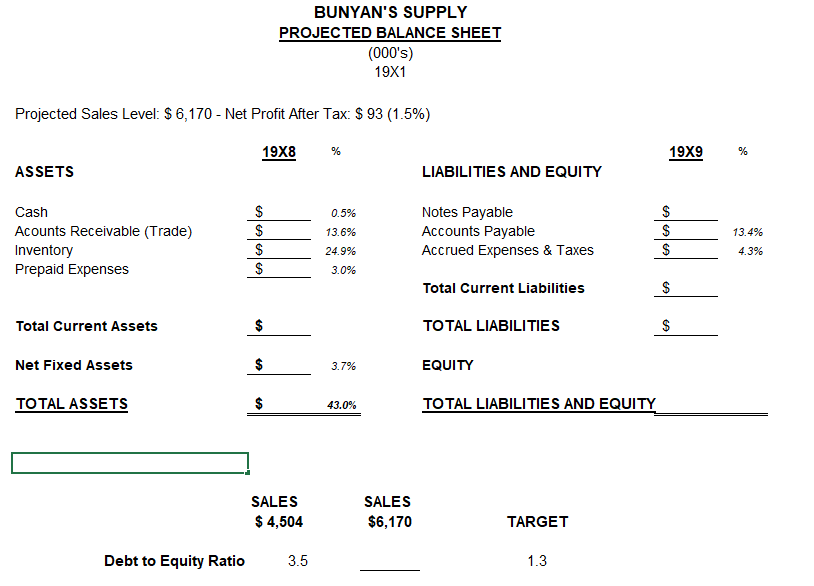
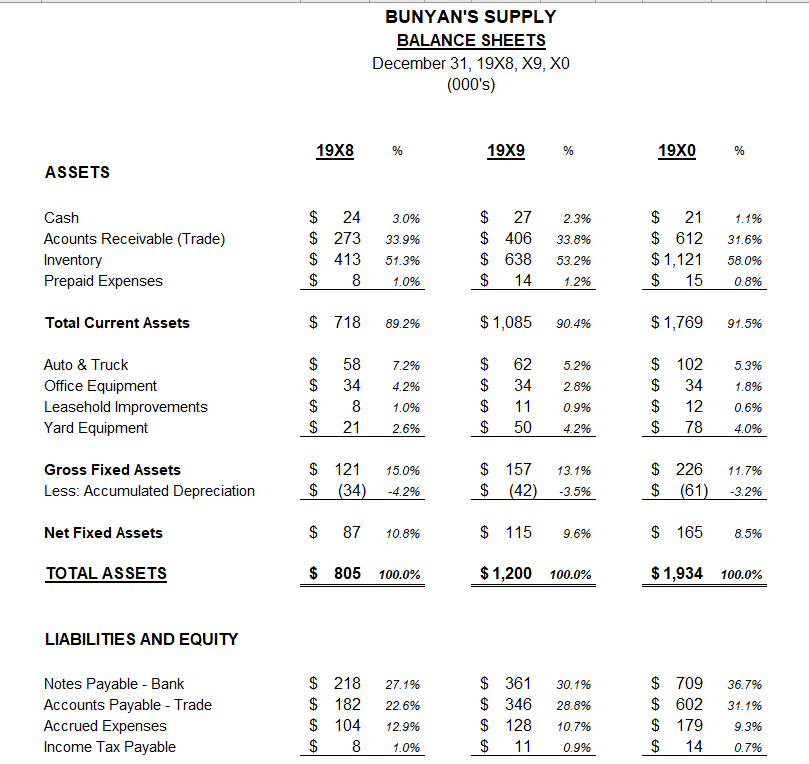
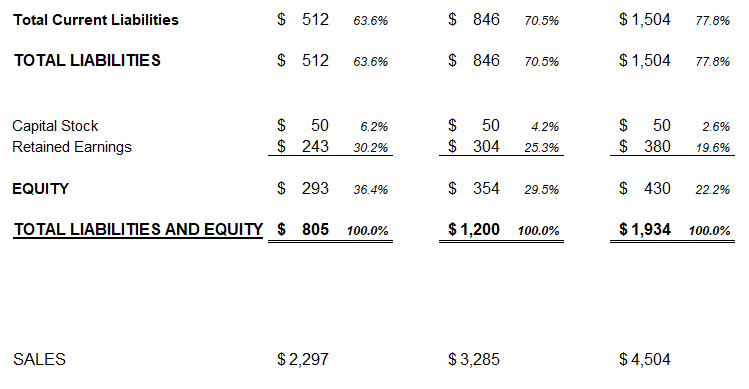
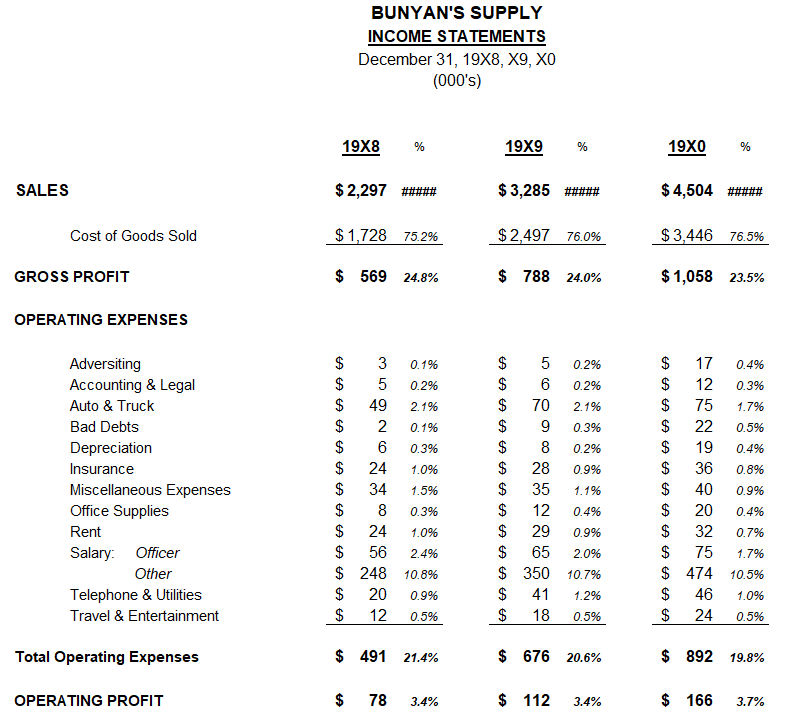

BUNYAN'S SUPPLY PROJECTED BALANCE SHEET (000's) 19X1 Projected Sales Level: $ 6,170 - Net Profit After Tax: $ 93 (1.5%) 19X8 % 19X9 % ASSETS LIABILITIES AND EQUITY Cash $ 0.5% Notes Payable Acounts Receivable (Trade) $ 13.6% Accounts Payable Inventory $ 24.9% Accrued Expenses & Taxes ASSA $ $ 13.4% $ 4.3% Prepaid Expenses $ 3.0% Total Current Liabilities $ Total Current Assets Net Fixed Assets TOTAL ASSETS TOTAL LIABILITIES $ CA $ 3.7% EQUITY $ 43.0% TOTAL LIABILITIES AND EQUITY SALES $ 4,504 SALES $6,170 TARGET Debt to Equity Ratio 3.5 1.3 ASSETS BUNYAN'S SUPPLY BALANCE SHEETS December 31, 19X8, X9, XO (000's) 19X8 % 19X9 % 19X0 % Cash $ 24 3.0% $ 27 2.3% $ 21 1.1% Acounts Receivable (Trade) $ 273 33.9% $ 406 33.8% $ 612 31.6% Inventory $ 413 51.3% $ 638 53.2% $1,121 58.0% Prepaid Expenses $ 8 1.0% $ 14 1.2% $ 15 0.8% Total Current Assets $ 718 89.2% $1,085 90.4% $1,769 91.5% Auto & Truck $ 58 7.2% 62 5.2% $ 102 5.3% Office Equipment $ 34 4.2% 34 2.8% $ 34 1.8% Leasehold Improvements $ 8 1.0% $ 11 0.9% $ 12 0.6% Yard Equipment $ 21 2.6% $ 50 4.2% $ 78 4.0% Gross Fixed Assets $ 121 15.0% Less: Accumulated Depreciation $ (34) -4.2% $ 157 $ (42) 13.1% $ 226 11.7% -3.5% $ (61) -3.2% Net Fixed Assets $ 87 10.8% $ 115 9.6% $ 165 8.5% TOTAL ASSETS $ 805 100.0% $1,200 100.0% $1,934 100.0% LIABILITIES AND EQUITY Notes Payable - Bank Accounts Payable - Trade Accrued Expenses Income Tax Payable $ 218 27.1% $ 182 $ 361 30.1% $ 709 36.7% 22.6% $ 346 28.8% $ 602 31.1% $ 104 12.9% $ 128 10.7% $ 179 9.3% $ 8 1.0% $ 11 0.9% $ 14 0.7% Total Current Liabilities $ 512 63.6% $ 846 70.5% $1,504 77.8% TOTAL LIABILITIES $ 512 63.6% $ 846 70.5% $ 1,504 77.8% Capital Stock Retained Earnings EQUITY $ 50 $ 243 6.2% 30.2% $ 50 $ 304 4.2% $ 50 2.6% 25.3% $ 380 19.6% $ 293 36.4% $ 354 29.5% $ 430 22.2% TOTAL LIABILITIES AND EQUITY $ 805 100.0% $1,200 100.0% $1,934 100.0% SALES $2,297 $3,285 $ 4,504 SALES Cost of Goods Sold GROSS PROFIT OPERATING EXPENSES BUNYAN'S SUPPLY INCOME STATEMENTS December 31, 19X8, X9, X0 (000's) 19X8 % 19X9 % 19X0 % $2,297 $ 3,285 ##### $1,728 75.2% $2,497 76.0% $ 4,504 ##### $3,446 76.5% $ 569 24.8% $ 788 24.0% $1,058 23.5% Adversiting Accounting & Legal Auto & Truck Bad Debts Depreciation Insurance Miscellaneous Expenses Office Supplies Rent SASASA SA SASA LA LA LA $ 3 0.1% $ 5 0.2% 49 2.1% $ 2 0.1% EA EA EA GA $ 5 0.2% $ 6 0.2% $ 70 2.1% $ 9 0.3% $ 6 0.3% $ 8 0.2% 24 1.0% 28 0.9% SASASA CA SA GA $ 17 0.4% $ 12 0.3% $ 75 1.7% $ 22 0.5% $ 19 0.4% $ 36 0.8% $ 34 1.5% $ 35 1.1% $ 40 0.9% $ 8 0.3% $ 12 0.4% $ 20 0.4% $ 24 1.0% $ 29 0.9% $ 32 0.7% Salary: Officer $ 56 2.4% $ 65 2.0% $ 75 1.7% Other $ 248 10.8% $ 350 10.7% $ 474 10.5% Telephone & Utilities $ 20 0.9% $ 41 1.2% $ 46 1.0% Travel & Entertainment Total Operating Expenses OPERATING PROFIT $ 12 0.5% $ 18 0.5% $ 24 0.5% $ 491 21.4% $ 676 20.6% $ 892 19.8% $ 78 3.4% $ 112 3.4% $ 166 3.7% OTHER INCOME (EXPENSES) Interest $ (24) -1.0% $ (40) -1.2% $ (76) -1.7% PRETAX PROFIT $ 54 2.4% $ 72 2.2% $ 90 2.0% Income Tax $ 8 0.3% $ 11 0.3% $ 14 0.3% NET INCOME $ 46 2.0% $ 61 1.9% $ 76 1.7%
Step by Step Solution
There are 3 Steps involved in it
Step: 1

Get Instant Access to Expert-Tailored Solutions
See step-by-step solutions with expert insights and AI powered tools for academic success
Step: 2

Step: 3

Ace Your Homework with AI
Get the answers you need in no time with our AI-driven, step-by-step assistance
Get Started


