

Answered step by step
Verified Expert Solution
Question
1 Approved Answer
Burden Analysis (see tab Burden Analysis on the Excel Spreadsheet) A. Do a Trend Analysis for High Plains Bank in 2020 to 2021, and a
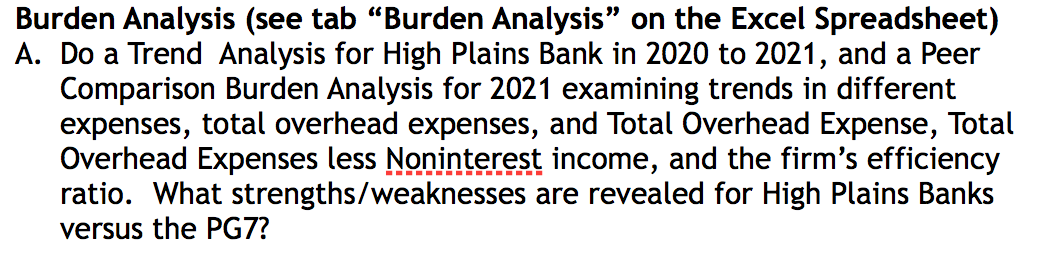
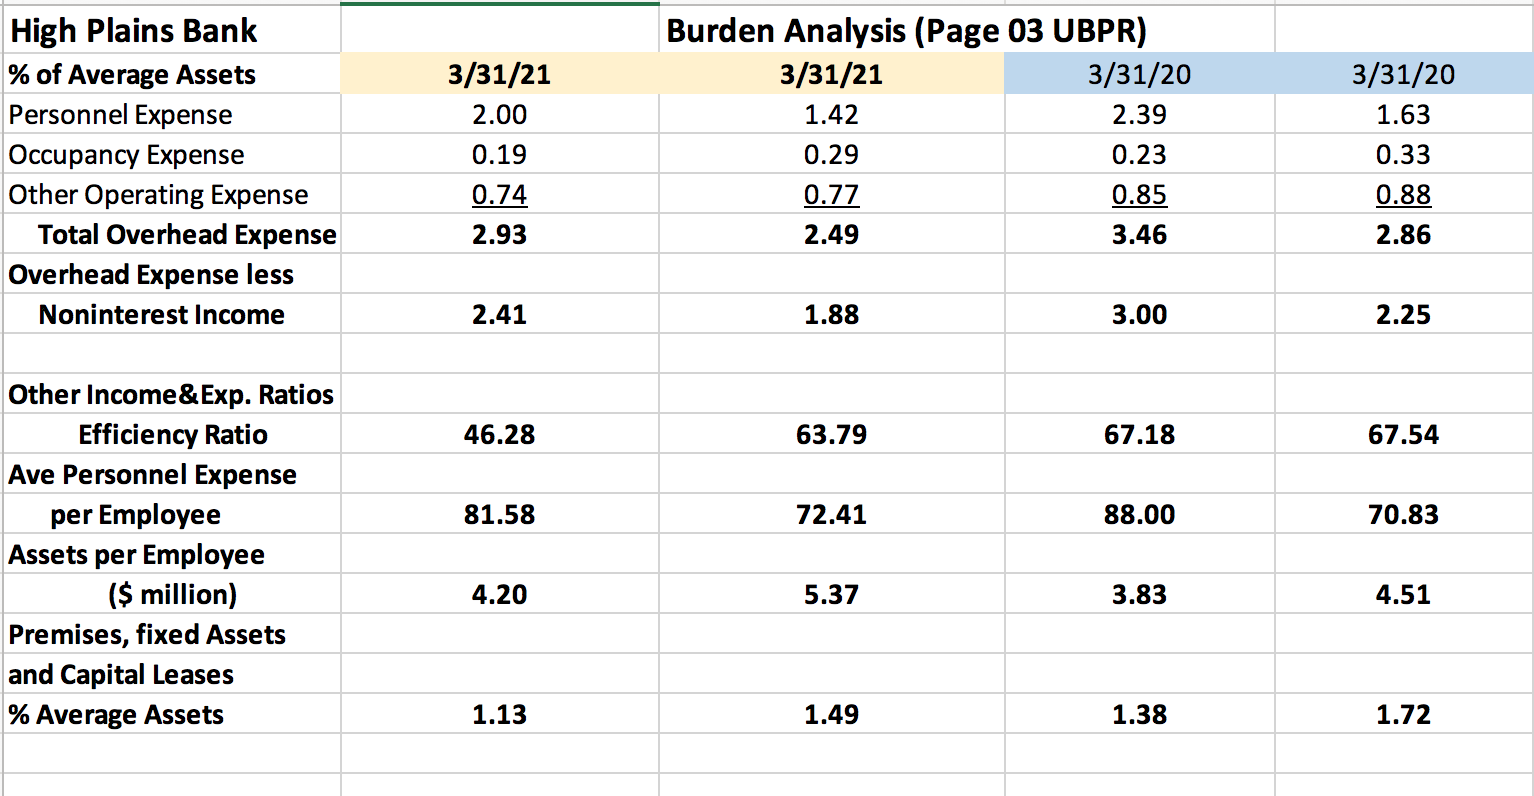
Burden Analysis (see tab Burden Analysis on the Excel Spreadsheet) A. Do a Trend Analysis for High Plains Bank in 2020 to 2021, and a Peer Comparison Burden Analysis for 2021 examining trends in different expenses, total overhead expenses, and Total Overhead Expense, Total Overhead Expenses less Noninterest income, and the firm's efficiency ratio. What strengths/weaknesses are revealed for High Plains Banks versus the PG7? 3/31/21 2.00 High Plains Bank % of Average Assets Personnel Expense Occupancy Expense Other Operating Expense Total Overhead Expense Overhead Expense less Noninterest Income Burden Analysis (Page 03 UBPR) 3/31/21 3/31/20 1.42 2.39 0.29 0.23 0.77 0.85 2.49 3.46 0.19 0.74 2.93 3/31/20 1.63 0.33 0.88 2.86 2.41 1.88 3.00 2.25 46.28 63.79 67.18 67.54 81.58 72.41 88.00 70.83 Other Income&Exp. Ratios Efficiency Ratio Ave Personnel Expense per Employee Assets per Employee ($ million) Premises, fixed Assets and Capital Leases % Average Assets 4.20 5.37 3.83 4.51 1.13 1.49 1.38 1.72 Burden Analysis (see tab Burden Analysis on the Excel Spreadsheet) A. Do a Trend Analysis for High Plains Bank in 2020 to 2021, and a Peer Comparison Burden Analysis for 2021 examining trends in different expenses, total overhead expenses, and Total Overhead Expense, Total Overhead Expenses less Noninterest income, and the firm's efficiency ratio. What strengths/weaknesses are revealed for High Plains Banks versus the PG7? 3/31/21 2.00 High Plains Bank % of Average Assets Personnel Expense Occupancy Expense Other Operating Expense Total Overhead Expense Overhead Expense less Noninterest Income Burden Analysis (Page 03 UBPR) 3/31/21 3/31/20 1.42 2.39 0.29 0.23 0.77 0.85 2.49 3.46 0.19 0.74 2.93 3/31/20 1.63 0.33 0.88 2.86 2.41 1.88 3.00 2.25 46.28 63.79 67.18 67.54 81.58 72.41 88.00 70.83 Other Income&Exp. Ratios Efficiency Ratio Ave Personnel Expense per Employee Assets per Employee ($ million) Premises, fixed Assets and Capital Leases % Average Assets 4.20 5.37 3.83 4.51 1.13 1.49 1.38 1.72
Step by Step Solution
There are 3 Steps involved in it
Step: 1

Get Instant Access to Expert-Tailored Solutions
See step-by-step solutions with expert insights and AI powered tools for academic success
Step: 2

Step: 3
Ace Your Homework with AI
Get the answers you need in no time with our AI-driven, step-by-step assistance
Get Started
Asset Allocation From Theory To Practice And Beyond
Authors: Mark P. Kritzman, William Kinlaw, David Turkington, Harry M. Markowitz
1st Edition
1119817714, 978-1119817710