BUS 511 CASE 4 CPA BEC S3 Cummings Corp. case Memo: August Production Data Memo To: All Cummings Corp. From: James Blake. managerPlumbing Parts division
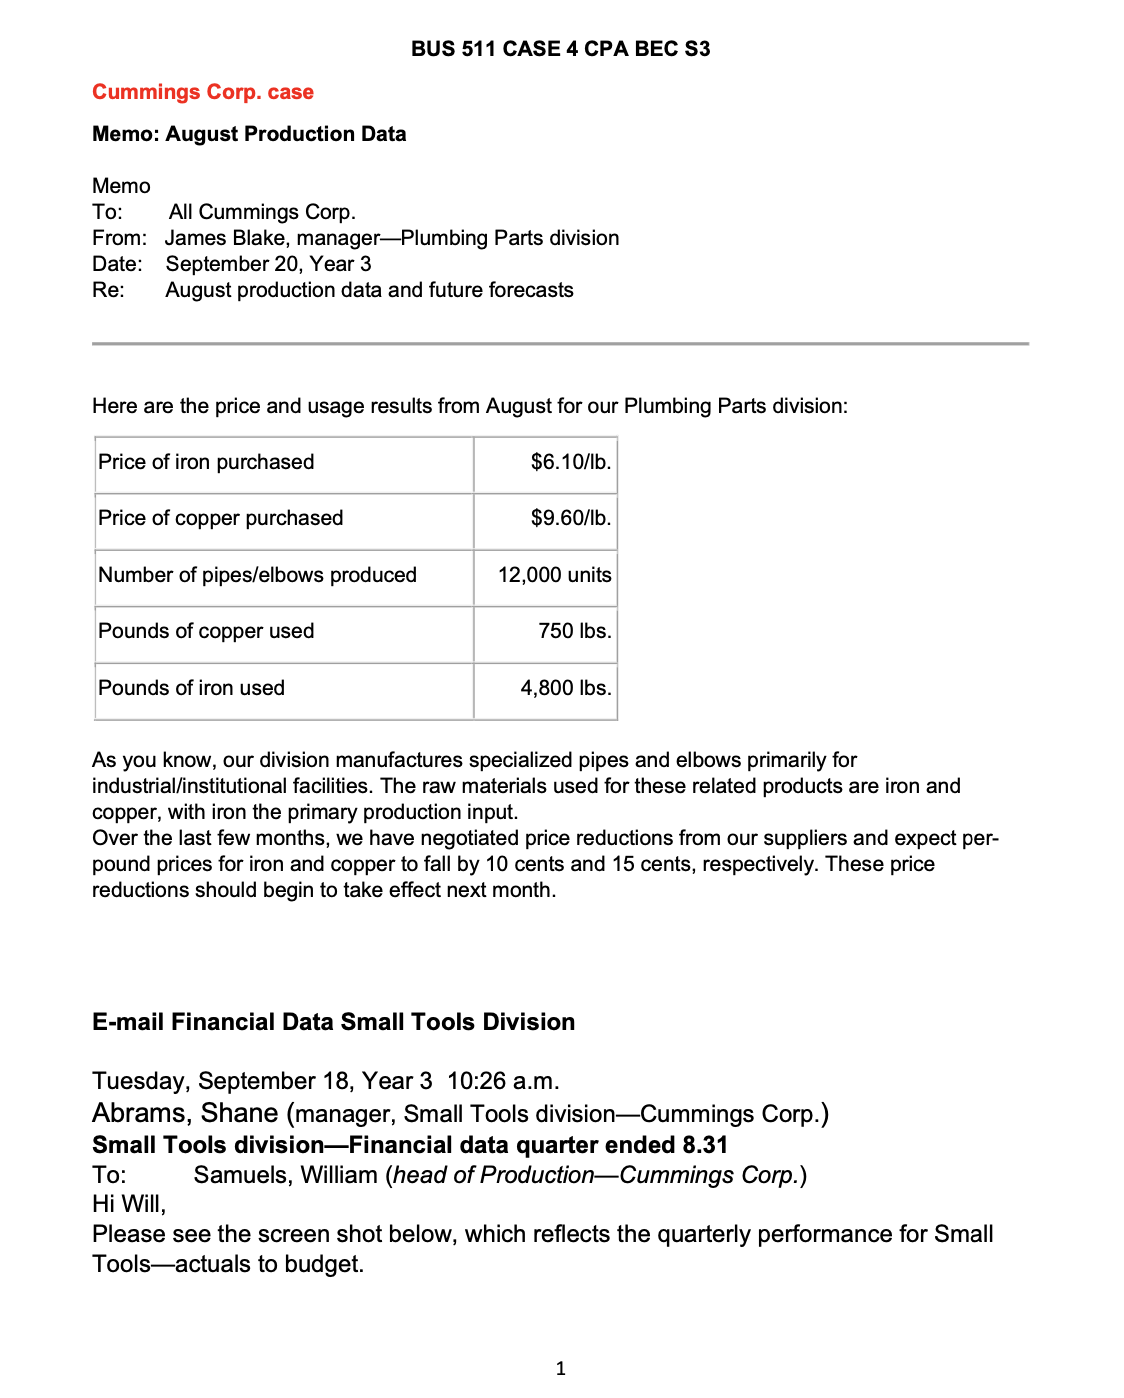
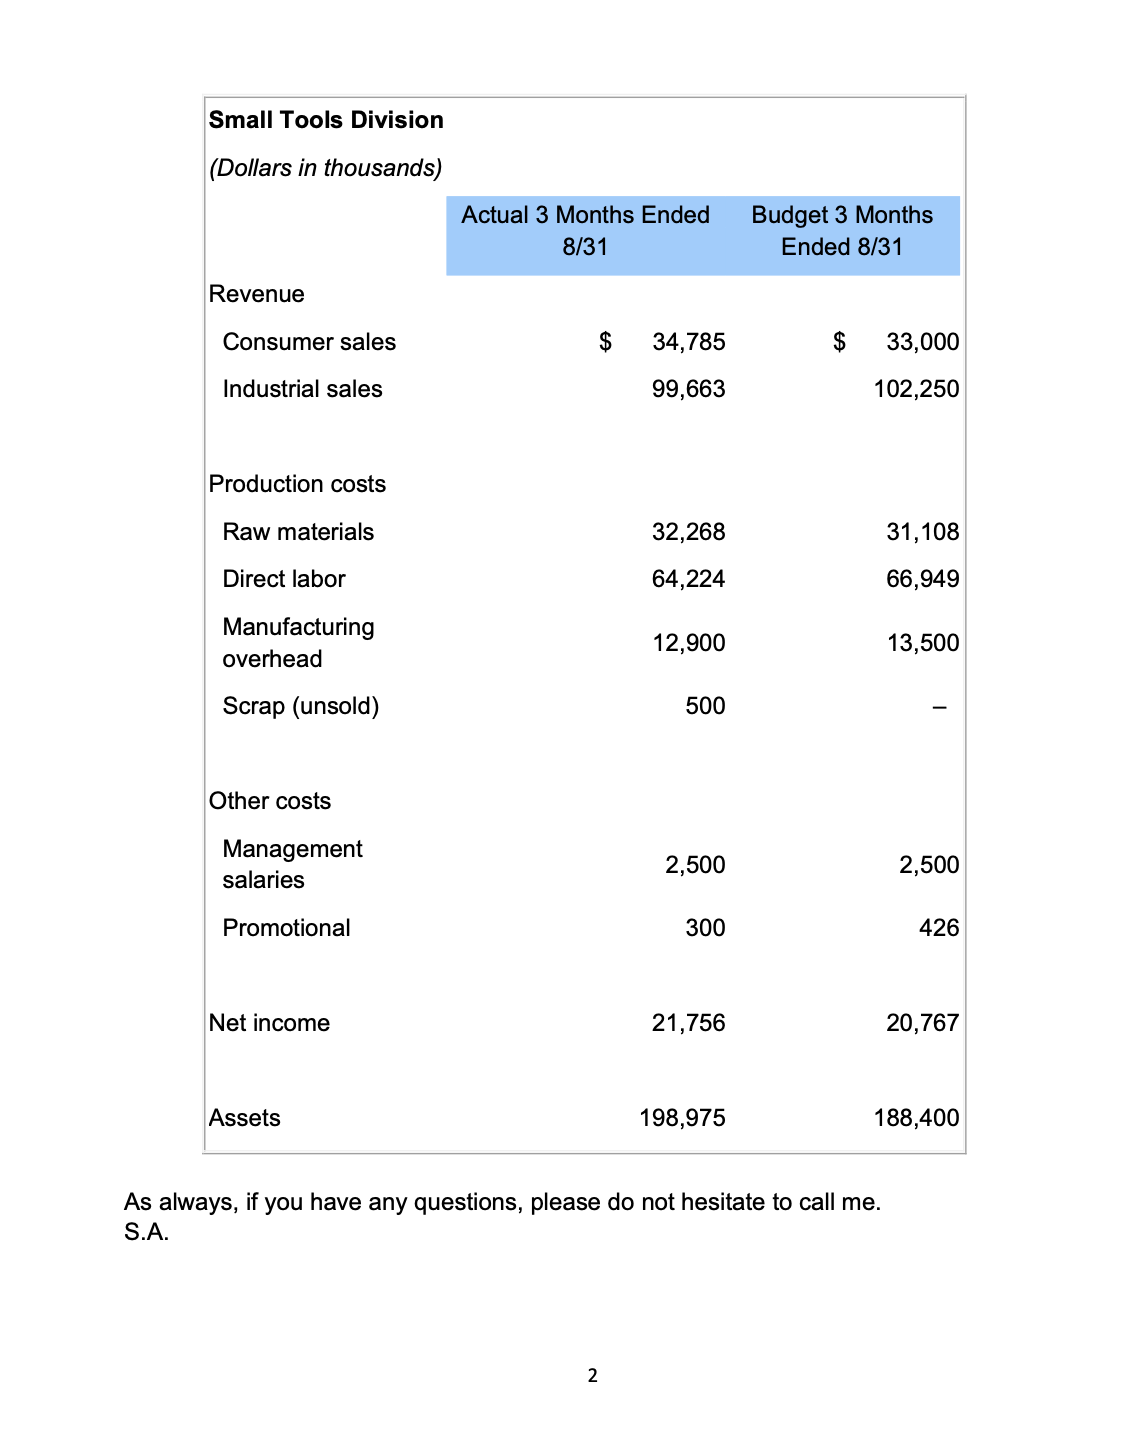
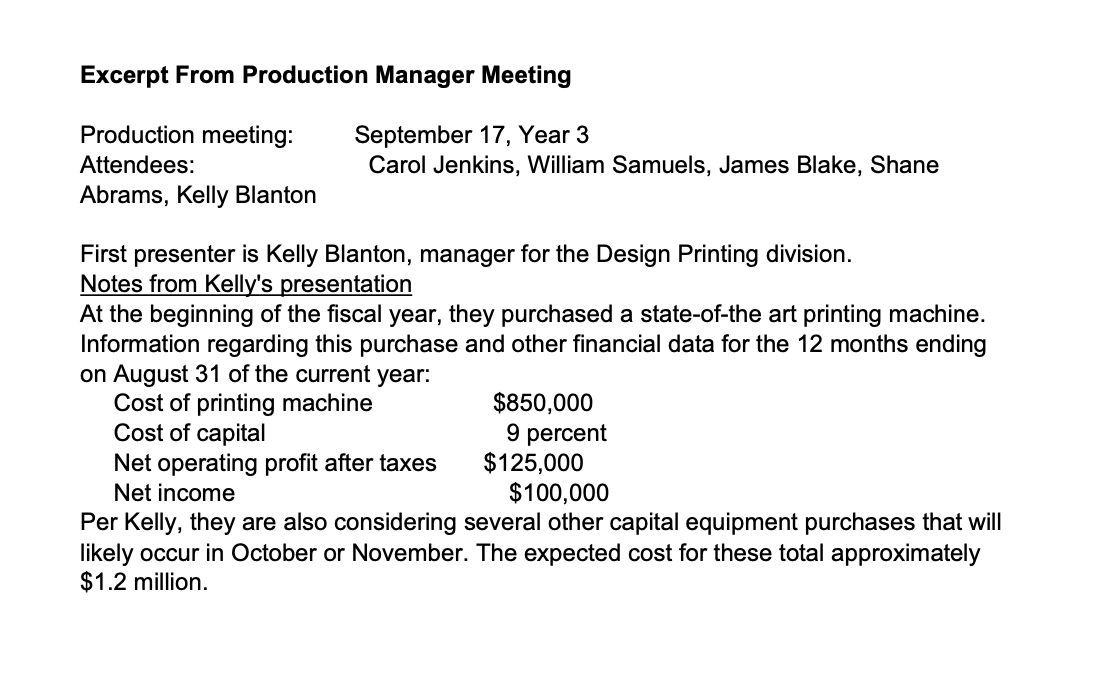
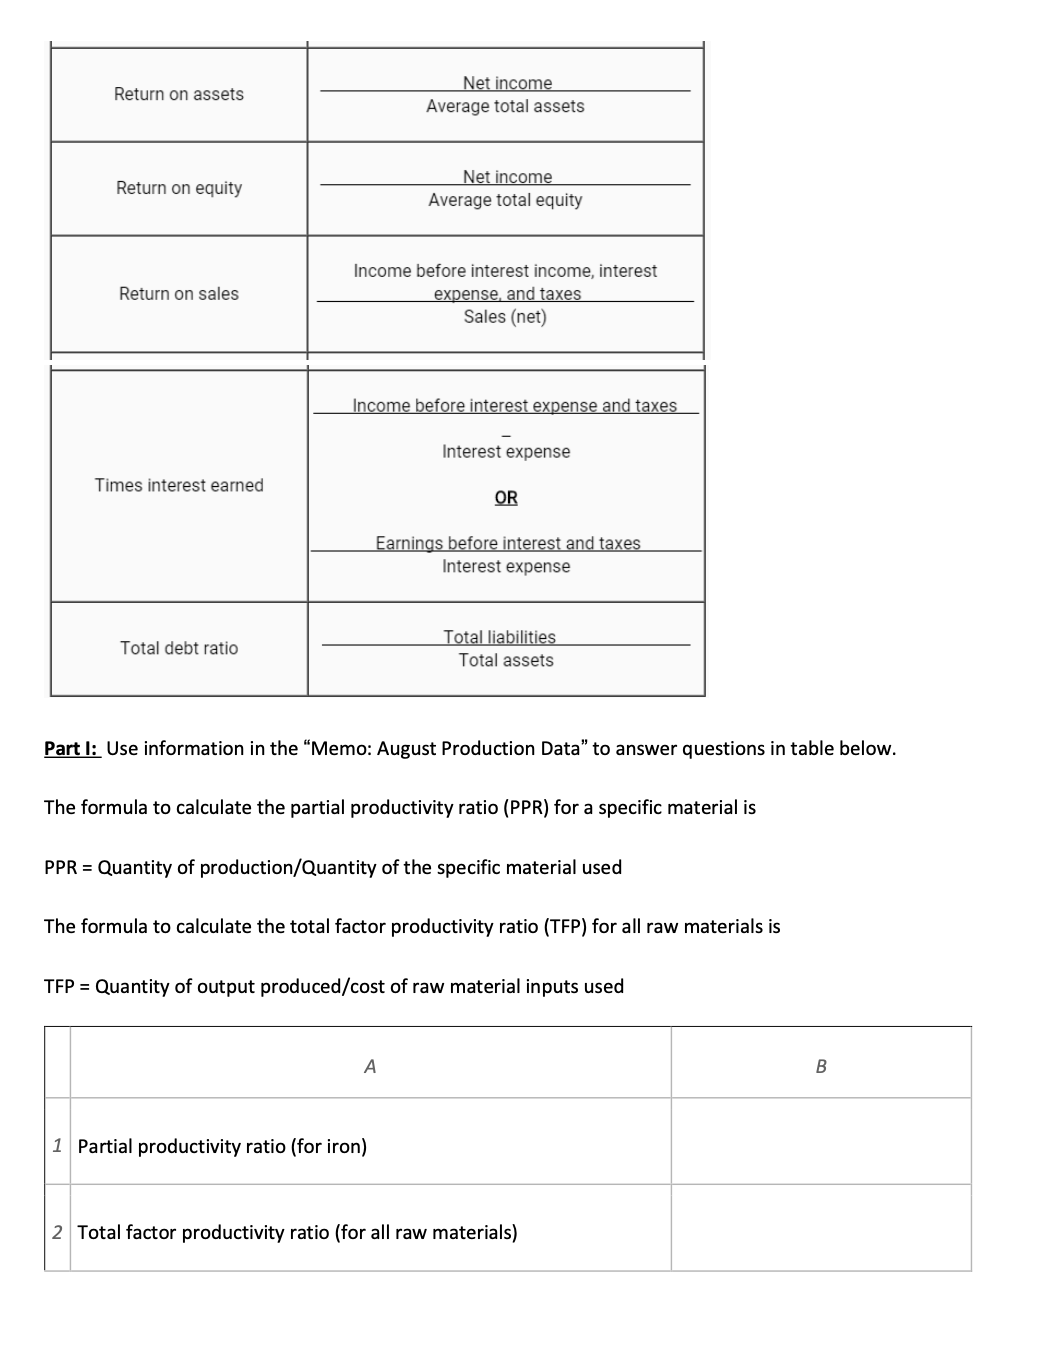
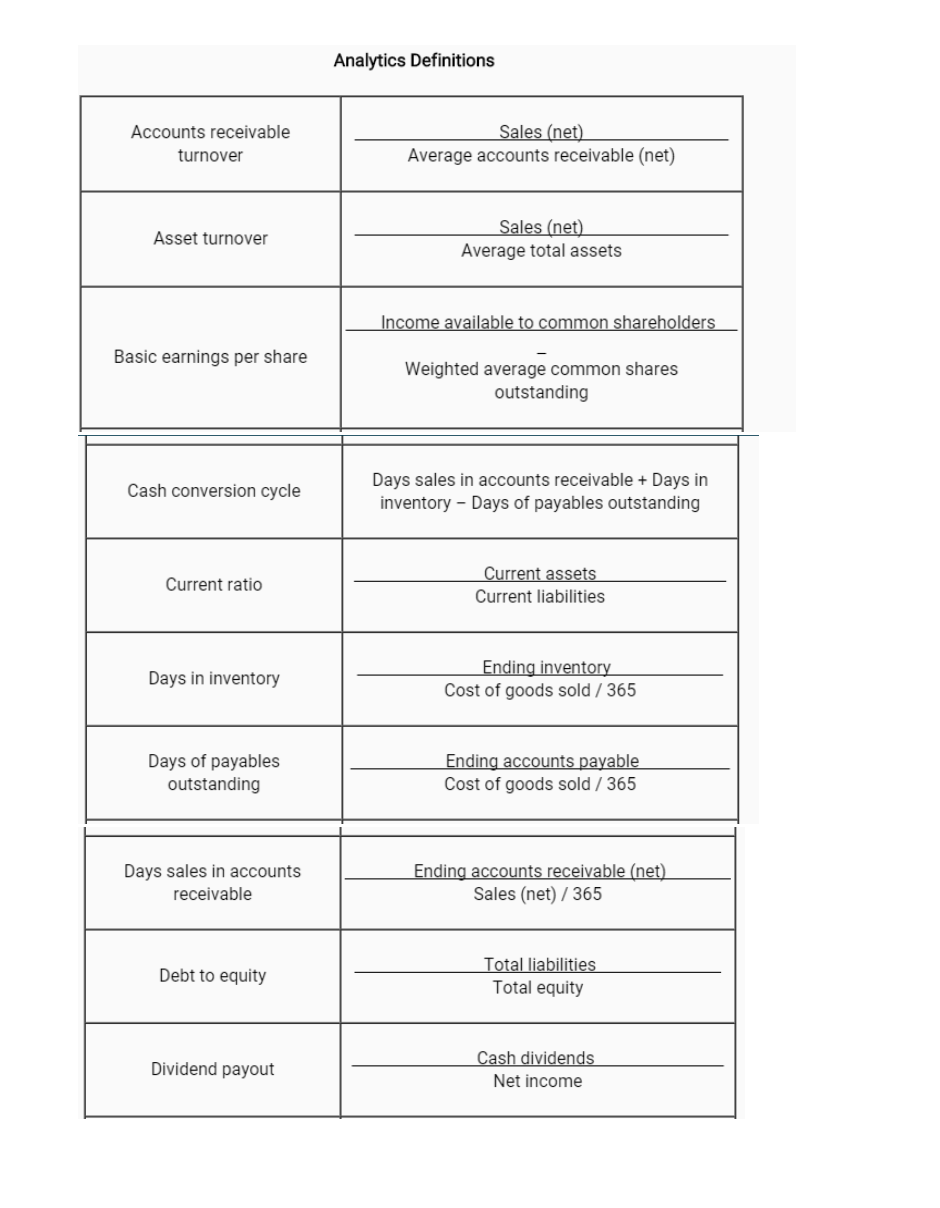
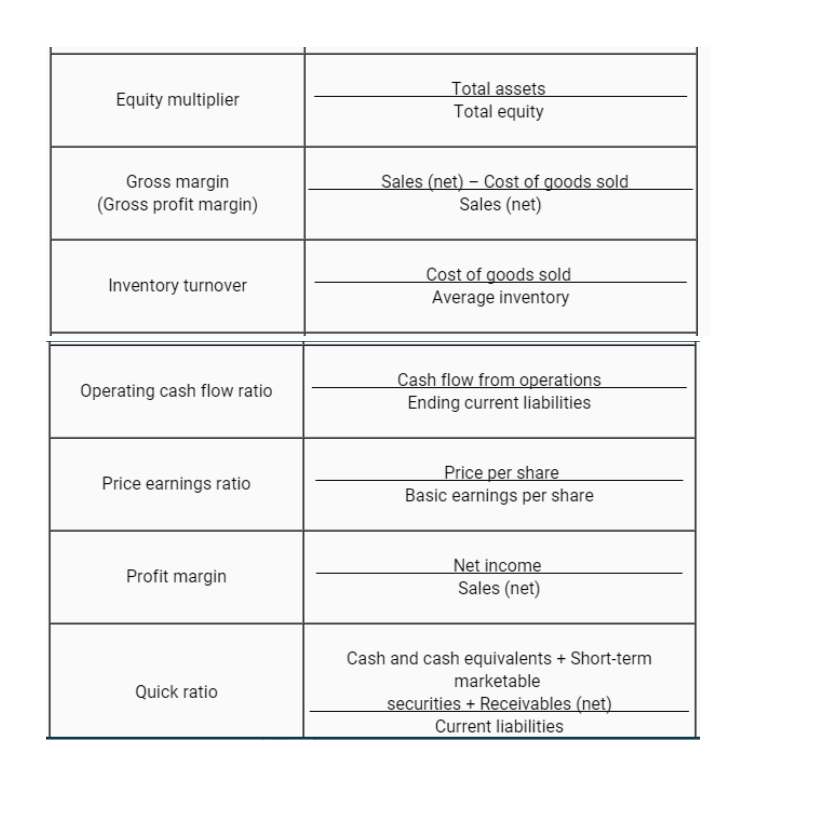
BUS 511 CASE 4 CPA BEC S3 Cummings Corp. case Memo: August Production Data Memo To: All Cummings Corp. From: James Blake. managerPlumbing Parts division Date: September 20. Year 3 Re: August production data and future forecasts Here are the price and usage results from August for our Plumbing Parts division: Price of iron purchased ' $6.10flb. Price of copper purchased ' $9.60flb. Number of pipeslelbows produced ' 12,000 units Pounds of copper used ' 750 lbs. Pounds of iron used ' 4,800 lbs. As you know, our division manufactures specialized pipes and elbows primarily for industrialnstitutional facilities. The raw materials used for these related products are iron and copper, with iron the primary production input. Over the last few months. we have negotiated price reductions from our suppliers and expect per- pound prices for iron and copper to fall by 10 cents and 15 cents. respectively. These price reductions should begin to take effect next month. E-mail Financial Data Small Tools Division Tuesday. September 18. Year 3 10:26 am. Abrams, Shane (manager, Small Tools divisionCummings Corp.) Small Tools divisionFinancial data quarter ended 8.31 To: Samuels, William (head of ProductionCummings Corp.) Hi Will, Please see the screen shot below. which reects the quarterly performance for Small Toolsactuals to budget. Small Tools Division (Dollars in thousands) Actual 3 Months Ended Budget 3 Months 8/31 Ended 8/31 Revenue Consumer sales $ 34,785 33,000 Industrial sales 99,663 102,250 Production costs Raw materials 32,268 31, 108 Direct labor 64,224 66,949 Manufacturing 12,900 13,500 overhead Scrap (unsold) 500 Other costs Management 2,500 2,500 salaries Promotional 300 426 Net income 21,756 20,767 Assets 198,975 188,400 As always, if you have any questions, please do not hesitate to call me. S.A. 2Excerpt From Production Manager Meeting Production meeting: September 17, Year 3 Attendees: Carol Jenkins, William Samuels, James Blake, Shane Abrams, Kelly Blanton First presenter is Kelly Blanton, manager for the Design Printing division. Notes from Kelly's presentation At the beginning of the fiscal year, they purchased a state-of-the art printing machine. Information regarding this purchase and other financial data for the 12 months ending on August 31 of the current year: Cost of printing machine $850,000 Cost of capital 9 percent Net operating profit after taxes $125,000 Net income $100,000 Per Kelly, they are also considering several other capital equipment purchases that will likely occur in October or November. The expected cost for these total approximately $1.2 million.Analytics Definitions Accounts receivable Sales (net) turnover Average accounts receivable (net) Sales (net) Asset turnover Average total assets Income available to common shareholders Basic earnings per share Weighted average common shares outstanding Days sales in accounts receivable + Days in Cash conversion cycle inventory - Days of payables outstanding Current ratio Current assets Current liabilities Ending inventory Days in inventory Cost of goods sold / 365 Days of payables Ending accounts payable outstanding Cost of goods sold / 365 Days sales in accounts Ending accounts receivable (net) receivable Sales (net) / 365 Total liabilities Debt to equity Total equity Cash dividends Dividend payout Net incomeTotal assets Equity multiplier Total equity Gross margin Sales (net) - Cost of goods sold (Gross profit margin) Sales (net) Cost of goods sold Inventory turnover Average inventory Cash flow from operations Operating cash flow ratio Ending current liabilities Price per share Price earnings ratio Basic earnings per share Net income Profit margin Sales (net) Cash and cash equivalents + Short-term marketable Quick ratio securities + Receivables (net) Current liabilitiesNet income Return on assets Average total assets Net income Return on equity Average total equity Income before interest income, interest Return on sales expense, and taxes Sales (net) Income before interest expense and taxes Interest expense Times interest earned OR Earnings before interest and taxes Interest expense Total debt ratio Total liabilities Total assets Part 1: Use information in the "Memo: August Production Data" to answer questions in table below. The formula to calculate the partial productivity ratio (PPR) for a specific material is PPR = Quantity of production/Quantity of the specific material used The formula to calculate the total factor productivity ratio (TFP) for all raw materials is TFP = Quantity of output produced/cost of raw material inputs used A B 1 Partial productivity ratio (for iron) 2 Total factor productivity ratio (for all raw materials)
Step by Step Solution
There are 3 Steps involved in it
Step: 1
Get Instant Access to Expert-Tailored Solutions
See step-by-step solutions with expert insights and AI powered tools for academic success
Step: 2
Step: 3
Ace Your Homework with AI
Get the answers you need in no time with our AI-driven, step-by-step assistance