Answered step by step
Verified Expert Solution
Question
1 Approved Answer
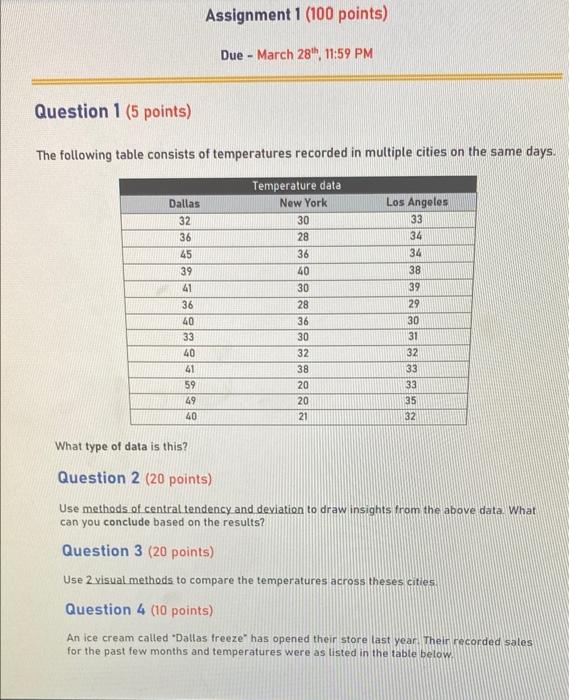
business analytics assignment 1 Assignment 1 (100 points) Due - March 28th 11:59 PM - Question 1 (5 points) The following table consists of temperatures
business analytics assignment 1 

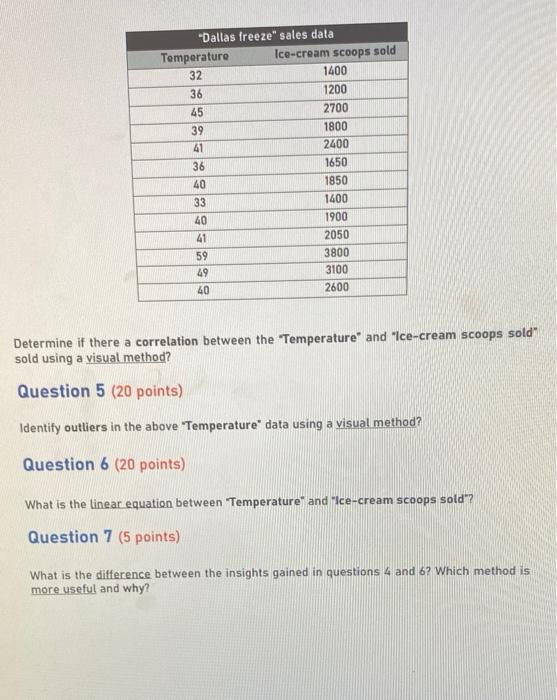
Assignment 1 (100 points) Due - March 28th 11:59 PM - Question 1 (5 points) The following table consists of temperatures recorded in multiple cities on the same days. Dallas 32 36 45 39 41 36 40 33 40 41 59 49 40 Temperature data New York 30 28 36 40 30 28 36 30 32 38 20 20 21 Los Angeles 33 34 34 38 39 29 30 31 32 33 33 35 32 What type of data is this? Question 2 (20 points) Use methods of central tendency and deviation to draw insights from the above data. What can you conclude based on the results? Question 3 (20 points) Use 2 visual methods to compare the temperatures across theses cities Question 4 (10 points) An ice cream called "Dallas freeze" has opened their store last year. Their recorded sales for the past few months and temperatures were as listed in the table below. "Dallas freeze" sales data Temperature Ice-cream scoops sold 32 1400 36 1200 45 2700 39 1800 41 2400 36 1650 40 1850 33 1400 40 1900 41 2050 59 3800 49 3100 40 2600 Determine if there a correlation between the Temperature and "Ice-cream scoops sold" sold using a visual method? Question 5 (20 points) Identify outliers in the above Temperature* data using a visual method? Question 6 (20 points) What is the linear equation between "Temperature and "Ice-cream scoops sold"? Question 7 (5 points) What is the difference between the insights gained in questions 4 and 6? Which method is more useful and why 

Step by Step Solution
There are 3 Steps involved in it
Step: 1

Get Instant Access to Expert-Tailored Solutions
See step-by-step solutions with expert insights and AI powered tools for academic success
Step: 2

Step: 3

Ace Your Homework with AI
Get the answers you need in no time with our AI-driven, step-by-step assistance
Get Started


