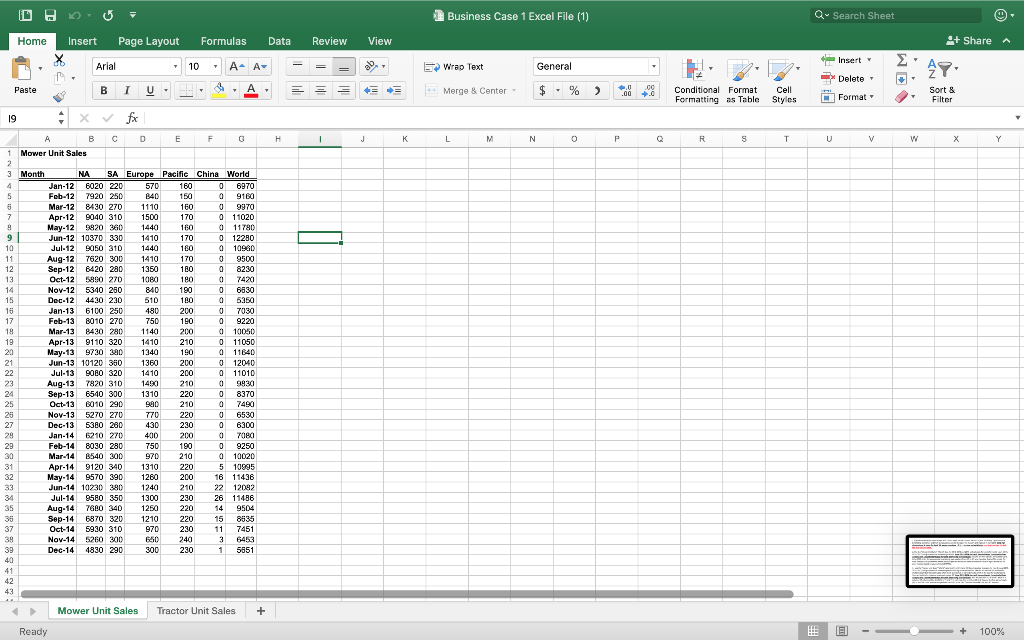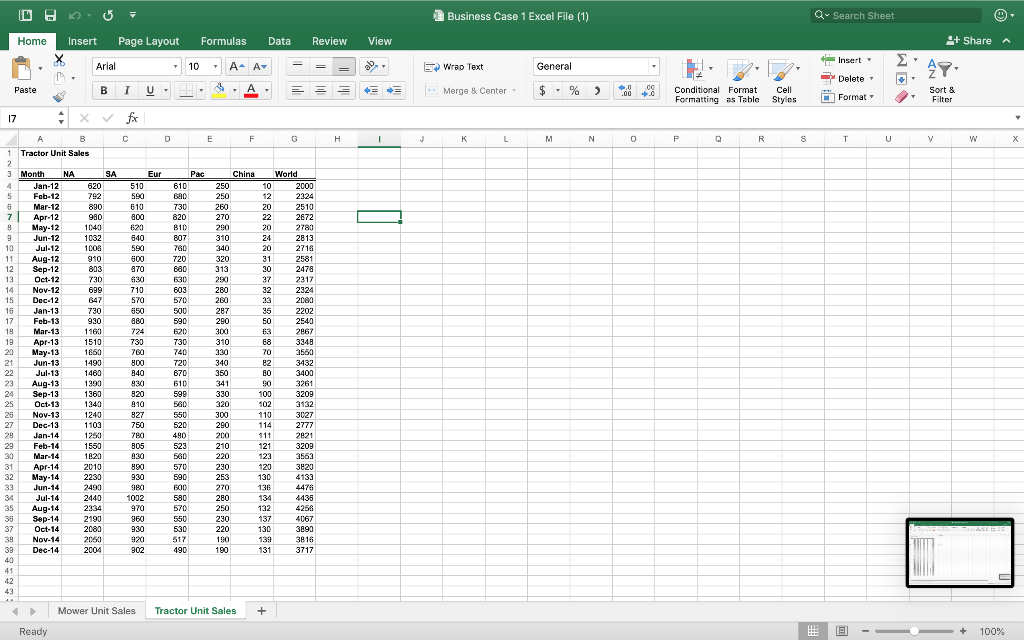


Business Case 1 Excel File (1) Q Search Sheet h Sheet + Share Review - = View bain * * Insert 2 ' A DO 5 = Home Insert Page Layout Formulas Data * Arial 10 AA = Paste B IUBA 19 X fx A B C D E F G H 1 Mower Unit Sales Ep Wrap Text Merge & Center - General $ - % Insert ) . - Y. Sort & Delete Format Conditional Format Formatting as Table Cell Styles Format I J K L M N O P Q R S T U V W X Y 160 11 1410 180 100 1410 210 3 Month NA SA Europe Pacific China World Jan-12 6020 220 570 160 0 6970 Feb-12 7920 250 B40 150 0 9160 Mar-12 8430 270 1110 160 0 9970 Apr-12 9040 310 1500 170 0 11020 May-12 3920 360 1440 1600 11780 Jun-12 10370 330 1410 170 0 12280 Jul-12 9050 310 1440 0 10980 Aug-12 7620 300 170 0 9500 Sep-12 B420 280 1350 0 8230 Oct-12 5990 270 1080 180 0 7420 Noy-12 5340 250 06530 Dec-12 4430 230 510 160 0 5350 Jan-13 6100 250 480 200 0 7030 Feb-13 1010 270 750 0 9220 Mar-13 8430 280 1140 200 010050 Apr-13 0110 320 011050 May-13 9720 320 1340 0 11640 Jun-13 10120 350 1360 0 12040 Jul-13 080 320 1410 0 11010 Aug-13 7820 310 1490 210 09930 Sep-13 6540 300 220 08370 Oct-13 010 290 00 210 0 7490 Nov-13 270 270 220 0 6530 Dec-13 53B0 200 430 230 0 6300 Jan-14 1210 270 400 200 0 7080 Feb-14 8030 280 09250 Mar-14 B540 300 970 010020 Apr-14 9120 340 5 10995 May-14 9570 390 1260 18 11436 Jun-14 10230 300 1240 210 22 12082 Jul-14 9580 350 230 26 11486 Aug-14 7600 340 1250 220 14 9504 Sep-14 6870 320 1210 220 15 8535 Oct-14 5930 310 970 11 7451 Nov-14 5260 300 640 2403 6453 Dec-14 4830 290 300 2301 5651 200 200 770 750 1310 220 200 230 Mower Unit Sales Tractor Unit Sales + Ready El -- - + 100% 1. Create trendlines for both Mower and Tractor sales for the column "World" in year 2014 only. Determine the best fitting trendlines and from the equation, predict the sales for mowers and tractors in April 2015. Hint: For determining X value for April 15, assign numbers 1,2,3,.... to time series (X) data starting from Jan 2014 all the way to April 2015. 2. Use the "Mower Unit Sales" "World" data for 2012, 2013 and 2014 and calculate forecasts for next 3 years (2015, 2016, 2017) using exponential smoothing method. Note: 2012-2014 data will be considered the actual values and you will calculate forecasts for 2015-2017 using those actuals. Assume the first period's forecast for 2015 to be 7100 Units. For exponential forecasting, give a values from 0.1 to 0.9 and calculate 9 sets of forecasts. For each forecast, calculate MAPE (Mean absolute percent error) and determine which value of a you would use for your forecast based on your calculated MAPES. 3. Use the "Tractor Unit Sales" "World" data for 2012, 2013 and 2014 and calculate forecasts for next 3 years (2015, 2016, 2017) using exponential smoothing with trend adjustments method. (We did not include this method for midterm exam but it's widely used when there is presence of a trend in data which is the case for tractor sales). You can find the formulas on powerpoint page 37. Note: 2012-2014 data will be considered the actual values and you will calculate forecasts for 2015-2017 using those actuals. You will calculate Ft, Tt and FIT each as a column. FIT column will be the SUM of Ft and Tt in each row. Use a=0.4 and B=0.2. Assume the first period's sales (Ft) to be 2500 Units and the first period's trend (Tt) to be 100. Then Calculate MAD for your FIT forecast. Business Case 1 Excel File (1) Q Search Sheet h Sheet Data Review View E H. F . DO 5 = Home Insert Page Layout Formulas x Arial - 10 - A A Paste B IUB A 17 Xv fx A B C D E F Wrao Text Merge & Center General $ - % Insert Delete. Format + Share A ZT Sort & E ) Conditional Format Formatting as Table Cell Styles .. Filter G H I J K L M N O P Q R S T U V W X 1 Tractor Unit Sales Pac China 610 250 S A 620 7 92 890 980 1040 Eur 510 590 510 600 World 2000 12 2324 2510 620 250 260 3 Month NA Jan-12 Feb-12 Mar-12 Apr-12 May-12 Jun-12 Jul-12 Aug-12 Sep-12 Oct-12 730 820 B1D 270 2e72 290 840 2780 2013 2716 2581 590 310 340 760 720 1008 910 803 730 870 320 313 290 680 630 2478 630 2317 280 2324 647 570 2080 2202 730 650 680 500 590 620 287 260 2540 730 310 2867 3345 3560 3432 840 670 350 3400 930 1160 1510 1850 1490 1480 1390 1360 1340 1240 1103 1250 830 610 341 50 599 820 810 330 100 3261 3209 3132 3027 560 102 550 Dec-12 Jan-13 Feb-13 Mar-13 Apr-13 May 13 Jun-13 Jul-13 Aug-13 Sep-13 Oct.13 Noy-13 Dec 13 Jan-14 Feb-14 Mar-14 Apr-14 May-14 Jun-14 Jul-14 Aug.14 Sep-14 Oct 14 Nov.14 Dec-14 300 110 114 750 520 2777 200 200 210 111 1550 805 523 220 560 570 2821 3209 3563 3820 4133 4476 120 590 230 253 270 930 980 130 1620 2010 2230 2490 2440 2334 2190 2080 2050 2004 580 280 970 570 4258 960 550 137 4067 3890 530 250 230 220 190 190 930 920517 902 490 130 139 3816 3717 131 Mower Unit Sales Tractor Unit Sales + Ready - + 100% Business Case 1 Excel File (1) Q Search Sheet h Sheet + Share Review - = View bain * * Insert 2 ' A DO 5 = Home Insert Page Layout Formulas Data * Arial 10 AA = Paste B IUBA 19 X fx A B C D E F G H 1 Mower Unit Sales Ep Wrap Text Merge & Center - General $ - % Insert ) . - Y. Sort & Delete Format Conditional Format Formatting as Table Cell Styles Format I J K L M N O P Q R S T U V W X Y 160 11 1410 180 100 1410 210 3 Month NA SA Europe Pacific China World Jan-12 6020 220 570 160 0 6970 Feb-12 7920 250 B40 150 0 9160 Mar-12 8430 270 1110 160 0 9970 Apr-12 9040 310 1500 170 0 11020 May-12 3920 360 1440 1600 11780 Jun-12 10370 330 1410 170 0 12280 Jul-12 9050 310 1440 0 10980 Aug-12 7620 300 170 0 9500 Sep-12 B420 280 1350 0 8230 Oct-12 5990 270 1080 180 0 7420 Noy-12 5340 250 06530 Dec-12 4430 230 510 160 0 5350 Jan-13 6100 250 480 200 0 7030 Feb-13 1010 270 750 0 9220 Mar-13 8430 280 1140 200 010050 Apr-13 0110 320 011050 May-13 9720 320 1340 0 11640 Jun-13 10120 350 1360 0 12040 Jul-13 080 320 1410 0 11010 Aug-13 7820 310 1490 210 09930 Sep-13 6540 300 220 08370 Oct-13 010 290 00 210 0 7490 Nov-13 270 270 220 0 6530 Dec-13 53B0 200 430 230 0 6300 Jan-14 1210 270 400 200 0 7080 Feb-14 8030 280 09250 Mar-14 B540 300 970 010020 Apr-14 9120 340 5 10995 May-14 9570 390 1260 18 11436 Jun-14 10230 300 1240 210 22 12082 Jul-14 9580 350 230 26 11486 Aug-14 7600 340 1250 220 14 9504 Sep-14 6870 320 1210 220 15 8535 Oct-14 5930 310 970 11 7451 Nov-14 5260 300 640 2403 6453 Dec-14 4830 290 300 2301 5651 200 200 770 750 1310 220 200 230 Mower Unit Sales Tractor Unit Sales + Ready El -- - + 100% 1. Create trendlines for both Mower and Tractor sales for the column "World" in year 2014 only. Determine the best fitting trendlines and from the equation, predict the sales for mowers and tractors in April 2015. Hint: For determining X value for April 15, assign numbers 1,2,3,.... to time series (X) data starting from Jan 2014 all the way to April 2015. 2. Use the "Mower Unit Sales" "World" data for 2012, 2013 and 2014 and calculate forecasts for next 3 years (2015, 2016, 2017) using exponential smoothing method. Note: 2012-2014 data will be considered the actual values and you will calculate forecasts for 2015-2017 using those actuals. Assume the first period's forecast for 2015 to be 7100 Units. For exponential forecasting, give a values from 0.1 to 0.9 and calculate 9 sets of forecasts. For each forecast, calculate MAPE (Mean absolute percent error) and determine which value of a you would use for your forecast based on your calculated MAPES. 3. Use the "Tractor Unit Sales" "World" data for 2012, 2013 and 2014 and calculate forecasts for next 3 years (2015, 2016, 2017) using exponential smoothing with trend adjustments method. (We did not include this method for midterm exam but it's widely used when there is presence of a trend in data which is the case for tractor sales). You can find the formulas on powerpoint page 37. Note: 2012-2014 data will be considered the actual values and you will calculate forecasts for 2015-2017 using those actuals. You will calculate Ft, Tt and FIT each as a column. FIT column will be the SUM of Ft and Tt in each row. Use a=0.4 and B=0.2. Assume the first period's sales (Ft) to be 2500 Units and the first period's trend (Tt) to be 100. Then Calculate MAD for your FIT forecast. Business Case 1 Excel File (1) Q Search Sheet h Sheet Data Review View E H. F . DO 5 = Home Insert Page Layout Formulas x Arial - 10 - A A Paste B IUB A 17 Xv fx A B C D E F Wrao Text Merge & Center General $ - % Insert Delete. Format + Share A ZT Sort & E ) Conditional Format Formatting as Table Cell Styles .. Filter G H I J K L M N O P Q R S T U V W X 1 Tractor Unit Sales Pac China 610 250 S A 620 7 92 890 980 1040 Eur 510 590 510 600 World 2000 12 2324 2510 620 250 260 3 Month NA Jan-12 Feb-12 Mar-12 Apr-12 May-12 Jun-12 Jul-12 Aug-12 Sep-12 Oct-12 730 820 B1D 270 2e72 290 840 2780 2013 2716 2581 590 310 340 760 720 1008 910 803 730 870 320 313 290 680 630 2478 630 2317 280 2324 647 570 2080 2202 730 650 680 500 590 620 287 260 2540 730 310 2867 3345 3560 3432 840 670 350 3400 930 1160 1510 1850 1490 1480 1390 1360 1340 1240 1103 1250 830 610 341 50 599 820 810 330 100 3261 3209 3132 3027 560 102 550 Dec-12 Jan-13 Feb-13 Mar-13 Apr-13 May 13 Jun-13 Jul-13 Aug-13 Sep-13 Oct.13 Noy-13 Dec 13 Jan-14 Feb-14 Mar-14 Apr-14 May-14 Jun-14 Jul-14 Aug.14 Sep-14 Oct 14 Nov.14 Dec-14 300 110 114 750 520 2777 200 200 210 111 1550 805 523 220 560 570 2821 3209 3563 3820 4133 4476 120 590 230 253 270 930 980 130 1620 2010 2230 2490 2440 2334 2190 2080 2050 2004 580 280 970 570 4258 960 550 137 4067 3890 530 250 230 220 190 190 930 920517 902 490 130 139 3816 3717 131 Mower Unit Sales Tractor Unit Sales + Ready - + 100%


