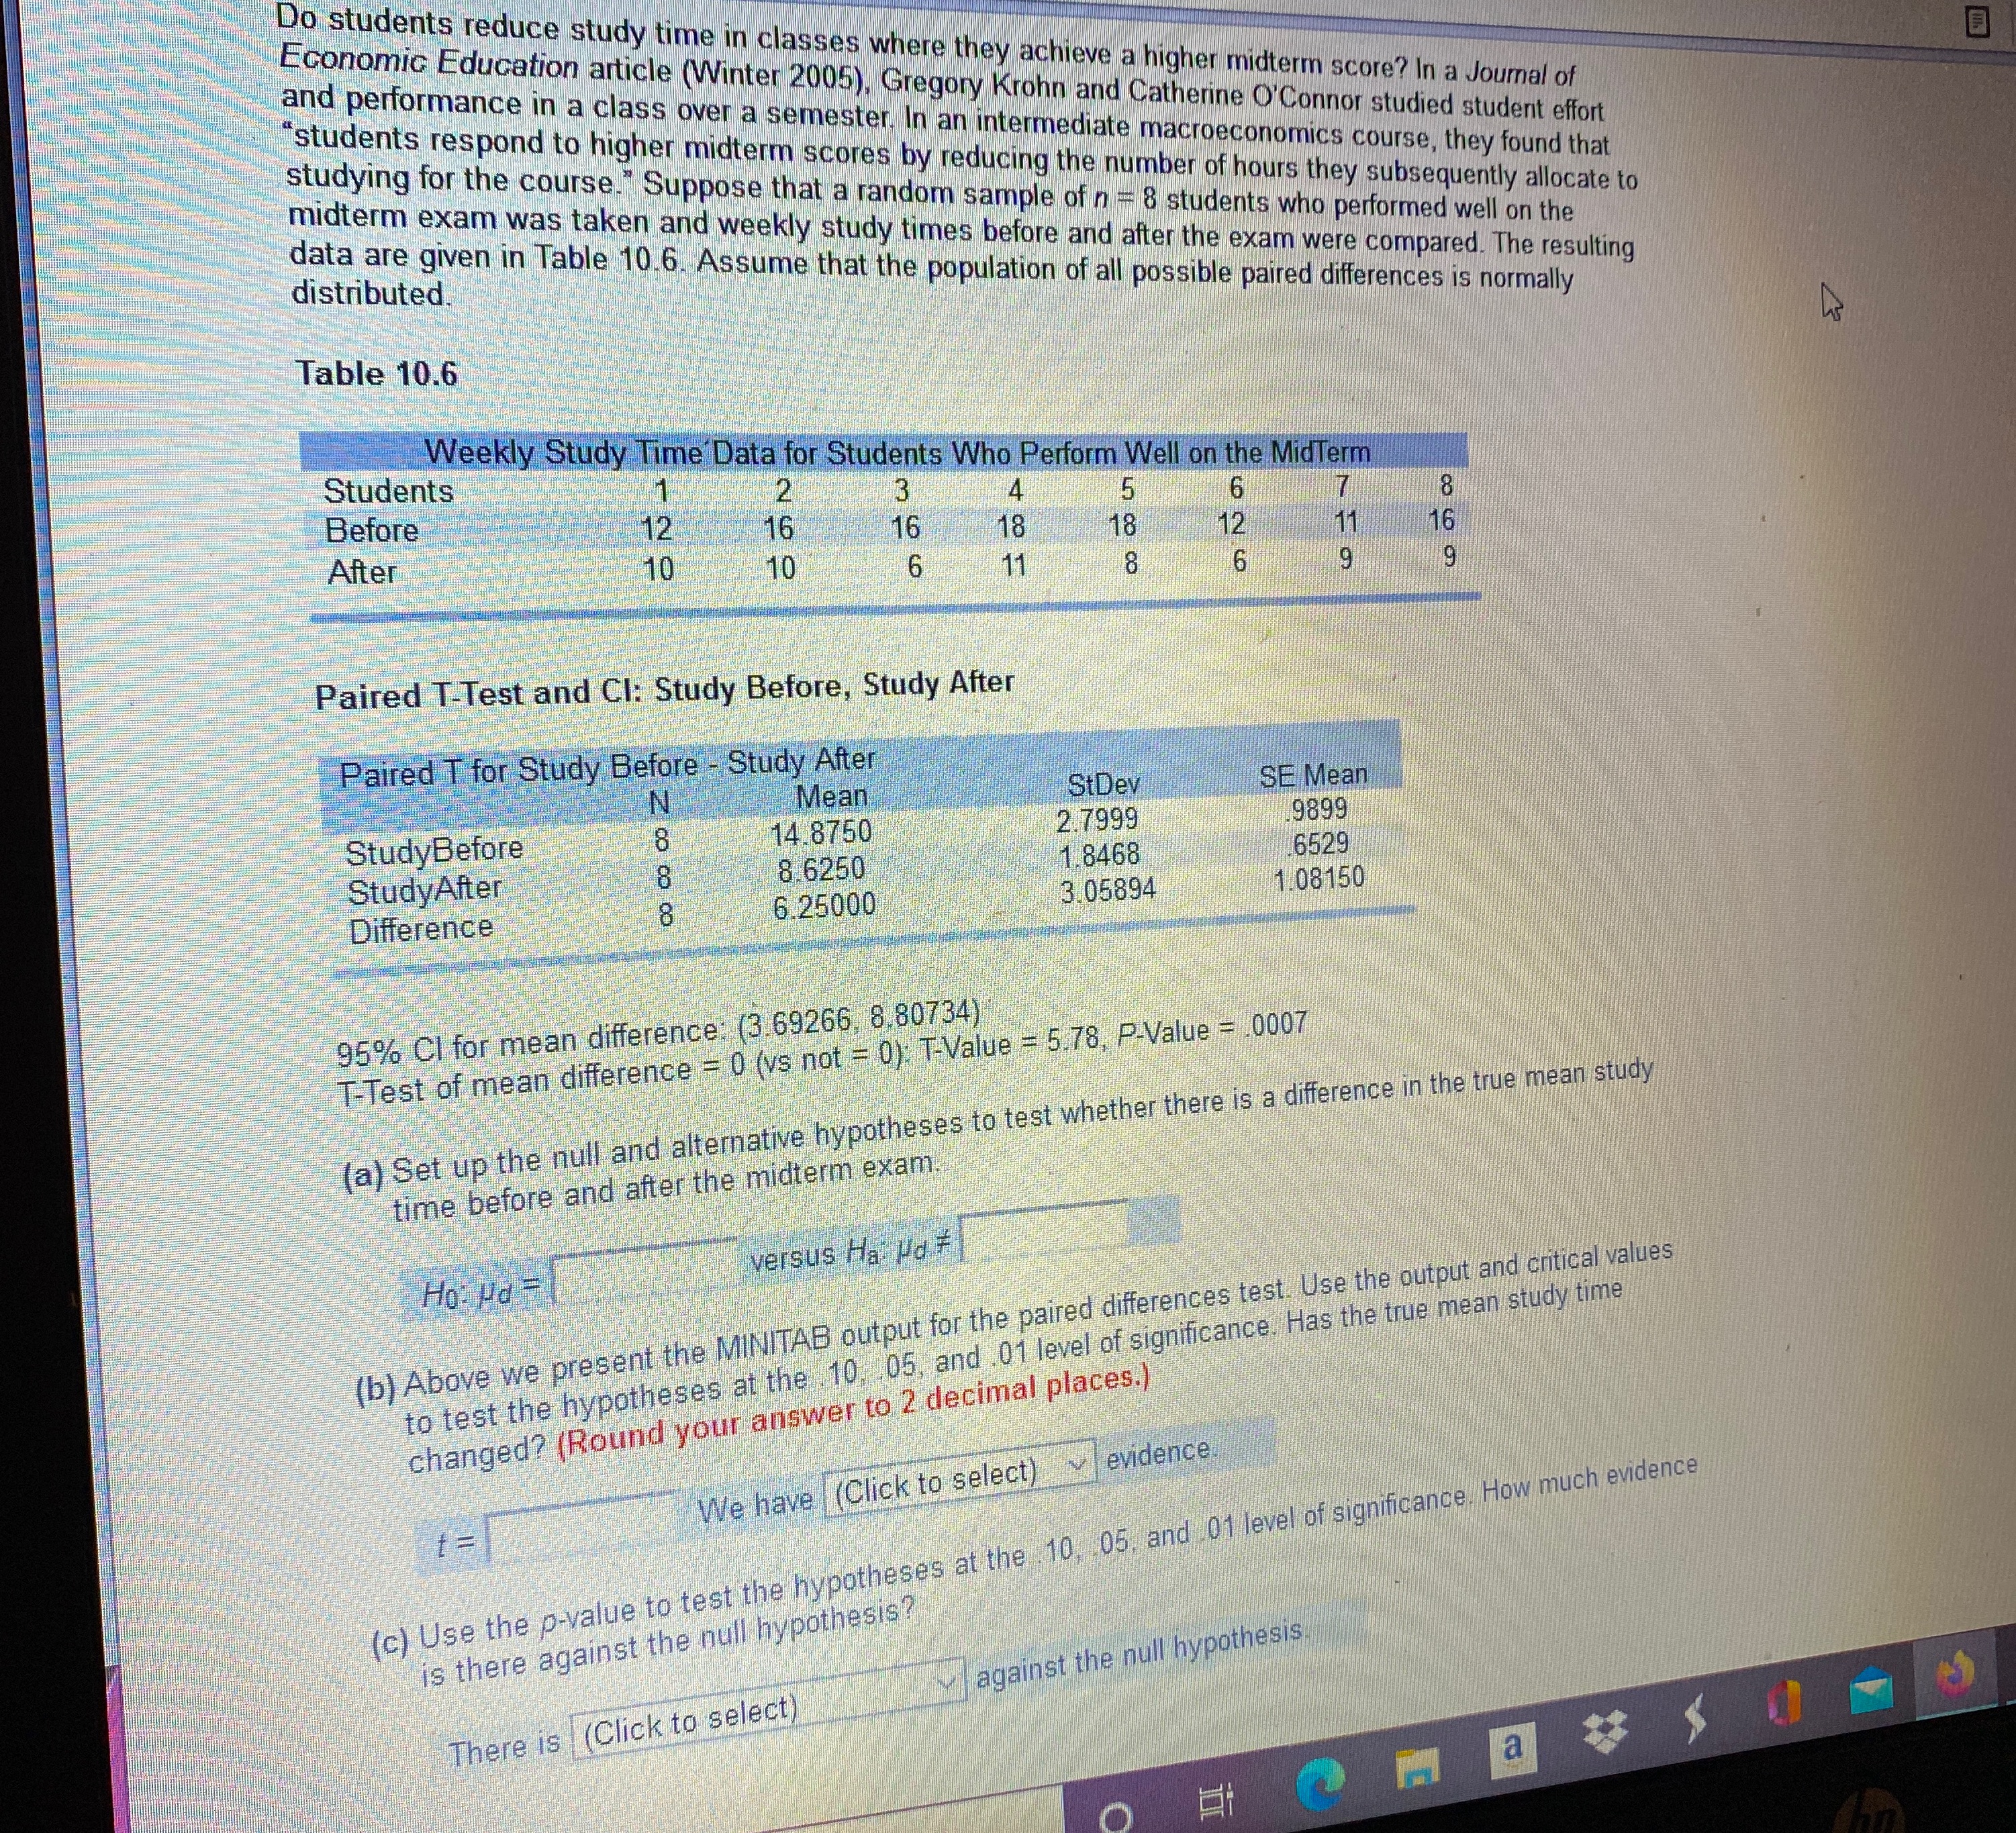
Business statistics
Do students reduce study time in classes where they achieve a higher midterm score? In a Journal of Economic Education article (Winter 2005), Gregory Krohn and Catherine O'Connor studied student effort and performance in a class over a semester. In an intermediate macroeconomics course, they found that students respond to higher midterm scores by reducing the number of hours they subsequently allocate to studying for the course." Suppose that a random sample of n = 8 students who performed well on the midterm exam was taken and weekly study times before and after the exam were compared. The resulting data are given in Table 10.6. Assume that the population of all possible paired differences is normally distributed. Table 10.6 Students Weekly Study Time Data for Students Who Perform Well on the MidTerm Before 16 4 18 5 6 18 12 7 After 8 6 8 16 Paired T-Test and Cl: Study Before, Study After Paired T for Study Before - Study After N Mean StDev SE Mean StudyBefore 8 14 8750 2.7999 9899 StudyAfter 8 8.6250 1.8468 6529 Difference 8 6.25000 3.05894 1.08150 95% Cl for mean difference: (3.69266, 8.80734) T-Test of mean difference = 0 (vs not = 0): T-Value = 5.78, P-Value = .0007 (a) Set up the null and alternative hypotheses to test whether there is a difference in the true mean study time before and after the midterm exam. Ho Ha = v (b) Above we present the MINITAB output for the paired differences test. Use the output and critical values to test the hypotheses at the 10. .05, and 01 level of significance. Has the true mean study time changed? (Round your answer to 2 decimal places.) We have (Click to select) ~ evidence = (c) Use the p-value to test the hypotheses at the 10, 05. and 01 level of significance. How much evidence is there against the null hypothesis? against the null hypothesis There is (Click to select) m a