By developing both the Baseline and Prime Shipping Models, the manager has concerns regarding the inputs that you used. First, certain input parameters aren't likely to change if the company were to use Prime. For example, the average selling price. However, there are other model inputs that are likely to be different. For example, product demand. Determine which model inputs are likely to remain the same whether Prime is adopted or not and which model inputs are likely to change.
-For all of the inputs in the model, how do changes in each input impact profitability?
-Is the input a global variable or a local variable? Why?
-Discuss how and why each of these inputs is likely to change and examine how sensitive the model is to changes to the inputs.
-Which of these inputs are critical to the profitability of the business?
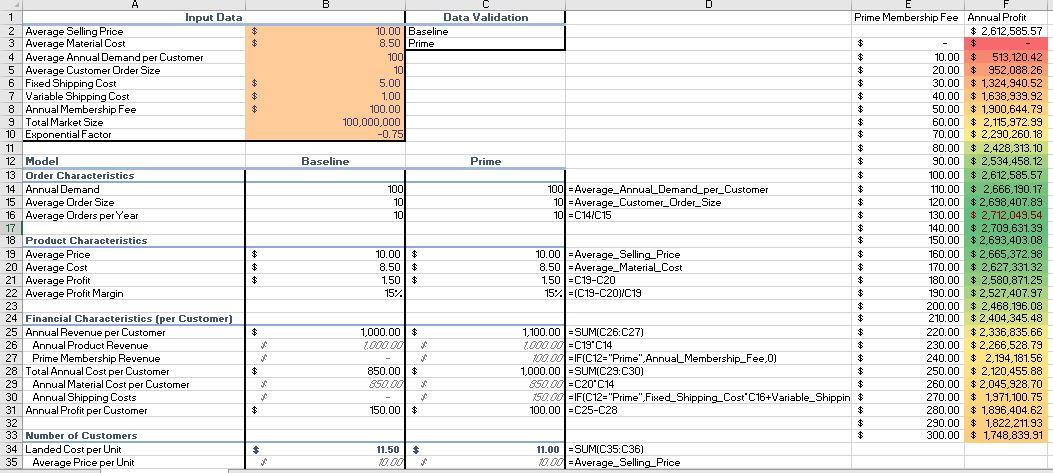
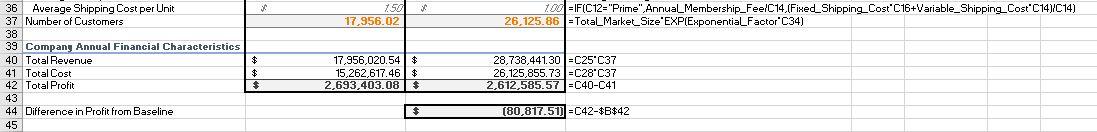
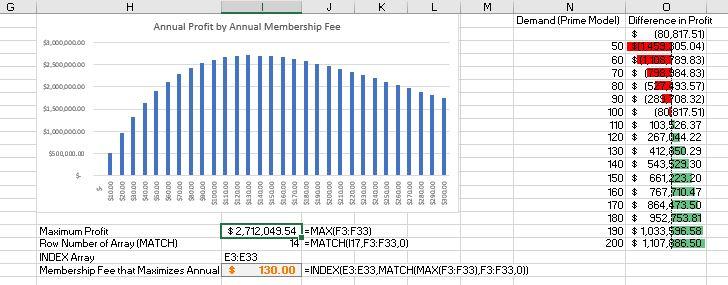
$ $ $ $ 1 Input Data 2 Average Selling Price 3 Average Material Cost 4 Average Annual Demand per Customer 5 Average Customer Order Size 6 Fixed Shipping Cost 7 Variable Shipping Cost 8 Annual Membership Fee 9 Total Market Size 10 Exponential Factor 11 12 Model 13 Order Characteristics 14 Annual Demand 15 Average Order Size 16 Average Orders per Year 17 18 Product Characteristics 19 Average Price 20 Average Cost 21 Average Profit 22 Average Profit Margin 23 24 Financial Characteristics (per Customer) 25 Annual Revenue per Customer 26 Annual Product Revenue 27 Prime Membership Revenue 28 Total Annual Cost per Customer 29 Annual Material Cost per Customer 30 Annual Shipping Costs 31 Annual Profit per Customer 32 33 Number of Customers 34 Landed Cost per Unit 35 Average Price per Unit E Data Validation Prime Membership Fee Annual Profit 10.00 Baseline $ 2,612,585.57 8.50 Prime $ $ 100 $ 10.00 $ 513,120.42 10 $ 20.00 $ 952,088.26 5.00 $ 30.00 $ 1,324,940.52 1.00 $ 40.00 $ 1,638,939.92 100.00 $ 50.00 $ 1,900 644.79 100,000,000 $ 60.00 $ 2.115,972.99 -0.75 $ 70.00 $ 2,290,260.18 $ 80.00 $ 2,428,313.10 Baseline Prime 90.00 $ 2,534,458.12 $ 100.00 $ 2,612,585.57 100 100 = Average_AnnualDemand_per_Customer 110.00 $ 2,666,190.17 10 10 = Average_Customer_Order_Size $ 120.00 $2,698,407.89 10 10lC14C15 $ 130.00 $ 2,712,049.54 $ 140.00 $ 2,709,631.39 $ 150.00 $2,693,403.08 10.00 $ 10.00 -Average_Selling Price $ 160.00 $2,665,372.98 8.50 $ 8.50 -Average_MaterialCost $ 170.00 $ 2,627,331.32 1.50 $ 1.50=C19-C20 $ 180.00 $ 2,580,871.25 15% 1524 =(C19-C20/C19 190.00 $2,527,407.97 $ 200.00 $ 2,468,196.08 $ 210.00 $2,404,345.48 1,000.00 $ 1,100.00 =SUM(C26:C27) $ 220.00 $2,336,835.66 TWW TOWW=C19 C14 $ 230.00 $2,266,528.79 w2.00 =IF(C12="Prime" Annual Membership_Fee,O) $ 240.00 $ 2,194,181,56 850.00 $ 1,000.00 -SUM(C29:C30) $ 250.00 $ 2.120,455.88 $50.00 C $50.00=C20'C14 $ 260.00 $2,045,928.70 150.00=IF(C12="Prime",Fixed_Shipping_Cost'C16+Variable_Shippin $ 270.00 $ 1,971,100.75 150.00 $ 100.00-C25-C28 $ 280.00 $ 1,896,404.62 $ 290.00 $ 1,822,211.93 $ 300.00 $ 1,748,839.91 11.50 $ 11.00 =SUM(C35:C36) . 0.00 Average_Selling Price $ $ $ $ $ C $ 38 * 750 17,956.02 100=IF(C12="Prime", Annual_Membership_Fee/C14.(Fixed_Shipping_Cost"C16+Variable_Shipping Cost'C14)/C14) 26.125.86 Total_Market_Size'EXP(ExponentialFactor C34) 36 Average Shipping Cost per Unit 37 Number of Customers 38 39 Company Annual Financial Characteristics 40 Total Revenue 41 Total Cost 42 Total Profit 43 44 Difference in Profit from Baseline 45 17,956,020.54 $ 15,262,617.46 $ 2,693,403.08 % 28,738,441.30 =C25 C37 26,125,855.73 =C28"C37 2,612,585.57 =C40-C41 $ $ (80,817.51) =C42-$B$42 G H K M N O Annual Profit by Annual Membership Fee Demand (Prime Model) Difference in Profit $ 37,00000000 (80,817.51) 50 1959 BO5.04) $2.500.000,00 60 11.08. 189.83) 70 $ 98,184.83) $2.000.000.00 80 $ (527493.57) 90 $ (289.708.32) 11.50000000 100 $ (80f817.51) $1,000,000.00 110 $ 103,$26.37 120 $ 267,644.22 $500,000.00 130 $ 412,850.29 140 $ 543,929.30 $ 150 $ 661,223.20 160 $ 767,710.47 170 $ 864,473.50 180 $ 952,753.81 Maximum Profit $2.712,049.54 1=MAX(F3:F33) 190 $ 1,033,996.58 Row Number of Array (MATCH) 14 =MATCH(117,F3:F33,0) 200 $ 1,107,886.50 INDEX Array E3:E33 Membership Fee that Maximizes Annual $ 130.00 =INDEX(E3:E33,MATCH(MAX(F3:F33),F3:F33,0)) S $10.00 $20.00 ODOS $40.00 00095 00095 QU0CS 0000 DO OES S100.00 $110.00 $12000 DODETS $140.00 Susco $160.00 $170.00 000BES $190.00 520000 $210.00 $22000 ODDERS 240.00 $250.00 $260.00 $270.00 $280.00 $29000 Sa0000 $ $ $ $ 1 Input Data 2 Average Selling Price 3 Average Material Cost 4 Average Annual Demand per Customer 5 Average Customer Order Size 6 Fixed Shipping Cost 7 Variable Shipping Cost 8 Annual Membership Fee 9 Total Market Size 10 Exponential Factor 11 12 Model 13 Order Characteristics 14 Annual Demand 15 Average Order Size 16 Average Orders per Year 17 18 Product Characteristics 19 Average Price 20 Average Cost 21 Average Profit 22 Average Profit Margin 23 24 Financial Characteristics (per Customer) 25 Annual Revenue per Customer 26 Annual Product Revenue 27 Prime Membership Revenue 28 Total Annual Cost per Customer 29 Annual Material Cost per Customer 30 Annual Shipping Costs 31 Annual Profit per Customer 32 33 Number of Customers 34 Landed Cost per Unit 35 Average Price per Unit E Data Validation Prime Membership Fee Annual Profit 10.00 Baseline $ 2,612,585.57 8.50 Prime $ $ 100 $ 10.00 $ 513,120.42 10 $ 20.00 $ 952,088.26 5.00 $ 30.00 $ 1,324,940.52 1.00 $ 40.00 $ 1,638,939.92 100.00 $ 50.00 $ 1,900 644.79 100,000,000 $ 60.00 $ 2.115,972.99 -0.75 $ 70.00 $ 2,290,260.18 $ 80.00 $ 2,428,313.10 Baseline Prime 90.00 $ 2,534,458.12 $ 100.00 $ 2,612,585.57 100 100 = Average_AnnualDemand_per_Customer 110.00 $ 2,666,190.17 10 10 = Average_Customer_Order_Size $ 120.00 $2,698,407.89 10 10lC14C15 $ 130.00 $ 2,712,049.54 $ 140.00 $ 2,709,631.39 $ 150.00 $2,693,403.08 10.00 $ 10.00 -Average_Selling Price $ 160.00 $2,665,372.98 8.50 $ 8.50 -Average_MaterialCost $ 170.00 $ 2,627,331.32 1.50 $ 1.50=C19-C20 $ 180.00 $ 2,580,871.25 15% 1524 =(C19-C20/C19 190.00 $2,527,407.97 $ 200.00 $ 2,468,196.08 $ 210.00 $2,404,345.48 1,000.00 $ 1,100.00 =SUM(C26:C27) $ 220.00 $2,336,835.66 TWW TOWW=C19 C14 $ 230.00 $2,266,528.79 w2.00 =IF(C12="Prime" Annual Membership_Fee,O) $ 240.00 $ 2,194,181,56 850.00 $ 1,000.00 -SUM(C29:C30) $ 250.00 $ 2.120,455.88 $50.00 C $50.00=C20'C14 $ 260.00 $2,045,928.70 150.00=IF(C12="Prime",Fixed_Shipping_Cost'C16+Variable_Shippin $ 270.00 $ 1,971,100.75 150.00 $ 100.00-C25-C28 $ 280.00 $ 1,896,404.62 $ 290.00 $ 1,822,211.93 $ 300.00 $ 1,748,839.91 11.50 $ 11.00 =SUM(C35:C36) . 0.00 Average_Selling Price $ $ $ $ $ C $ 38 * 750 17,956.02 100=IF(C12="Prime", Annual_Membership_Fee/C14.(Fixed_Shipping_Cost"C16+Variable_Shipping Cost'C14)/C14) 26.125.86 Total_Market_Size'EXP(ExponentialFactor C34) 36 Average Shipping Cost per Unit 37 Number of Customers 38 39 Company Annual Financial Characteristics 40 Total Revenue 41 Total Cost 42 Total Profit 43 44 Difference in Profit from Baseline 45 17,956,020.54 $ 15,262,617.46 $ 2,693,403.08 % 28,738,441.30 =C25 C37 26,125,855.73 =C28"C37 2,612,585.57 =C40-C41 $ $ (80,817.51) =C42-$B$42 G H K M N O Annual Profit by Annual Membership Fee Demand (Prime Model) Difference in Profit $ 37,00000000 (80,817.51) 50 1959 BO5.04) $2.500.000,00 60 11.08. 189.83) 70 $ 98,184.83) $2.000.000.00 80 $ (527493.57) 90 $ (289.708.32) 11.50000000 100 $ (80f817.51) $1,000,000.00 110 $ 103,$26.37 120 $ 267,644.22 $500,000.00 130 $ 412,850.29 140 $ 543,929.30 $ 150 $ 661,223.20 160 $ 767,710.47 170 $ 864,473.50 180 $ 952,753.81 Maximum Profit $2.712,049.54 1=MAX(F3:F33) 190 $ 1,033,996.58 Row Number of Array (MATCH) 14 =MATCH(117,F3:F33,0) 200 $ 1,107,886.50 INDEX Array E3:E33 Membership Fee that Maximizes Annual $ 130.00 =INDEX(E3:E33,MATCH(MAX(F3:F33),F3:F33,0)) S $10.00 $20.00 ODOS $40.00 00095 00095 QU0CS 0000 DO OES S100.00 $110.00 $12000 DODETS $140.00 Susco $160.00 $170.00 000BES $190.00 520000 $210.00 $22000 ODDERS 240.00 $250.00 $260.00 $270.00 $280.00 $29000 Sa0000