Question
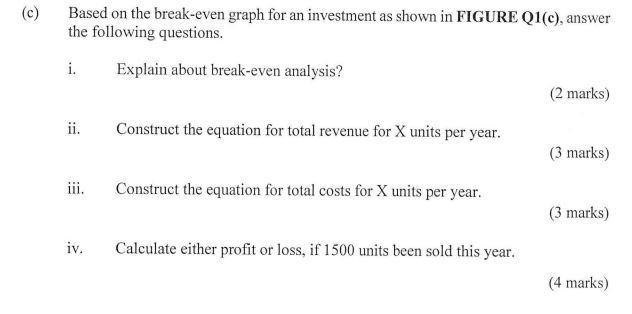
(c) Based on the break-even graph for an investment as shown in FIGURE Q1(c), answer the following questions. i. Explain about break-even analysis? ii.


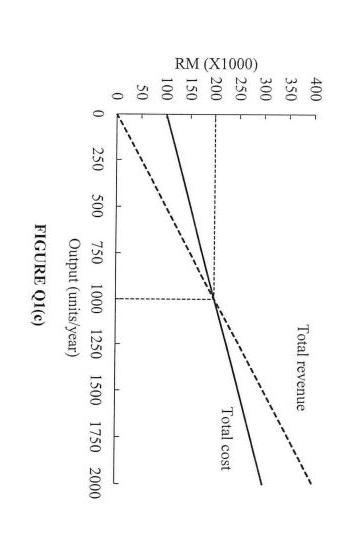
(c) Based on the break-even graph for an investment as shown in FIGURE Q1(c), answer the following questions. i. Explain about break-even analysis? ii. iii. iv. Construct the equation for total revenue for X units per year. Construct the equation for total costs for X units per year. Calculate either profit or loss, if 1500 units been sold this year. (2 marks) (3 marks) (3 marks) (4 marks) RM (X1000) 400 350 300 250 200 150 100 50 0 0 250 500 Total revenue Total cost 750 1000 1250 1500 1750 2000 Output (units/year) FIGURE Q1(c)
Step by Step Solution
3.42 Rating (155 Votes )
There are 3 Steps involved in it
Step: 1
i A breakeven analysis is a tool used by the firms for determinin...
Get Instant Access to Expert-Tailored Solutions
See step-by-step solutions with expert insights and AI powered tools for academic success
Step: 2

Step: 3

Ace Your Homework with AI
Get the answers you need in no time with our AI-driven, step-by-step assistance
Get StartedRecommended Textbook for
Income Tax Fundamentals 2013
Authors: Gerald E. Whittenburg, Martha Altus Buller, Steven L Gill
31st Edition
1111972516, 978-1285586618, 1285586611, 978-1285613109, 978-1111972516
Students also viewed these Accounting questions
Question
Answered: 1 week ago
Question
Answered: 1 week ago
Question
Answered: 1 week ago
Question
Answered: 1 week ago
Question
Answered: 1 week ago
Question
Answered: 1 week ago
Question
Answered: 1 week ago
Question
Answered: 1 week ago
Question
Answered: 1 week ago
Question
Answered: 1 week ago
Question
Answered: 1 week ago
Question
Answered: 1 week ago
Question
Answered: 1 week ago
Question
Answered: 1 week ago
Question
Answered: 1 week ago
Question
Answered: 1 week ago
Question
Answered: 1 week ago
Question
Answered: 1 week ago
Question
Answered: 1 week ago
Question
Answered: 1 week ago
Question
Answered: 1 week ago
Question
Answered: 1 week ago
View Answer in SolutionInn App


