

Answered step by step
Verified Expert Solution
Question
1 Approved Answer
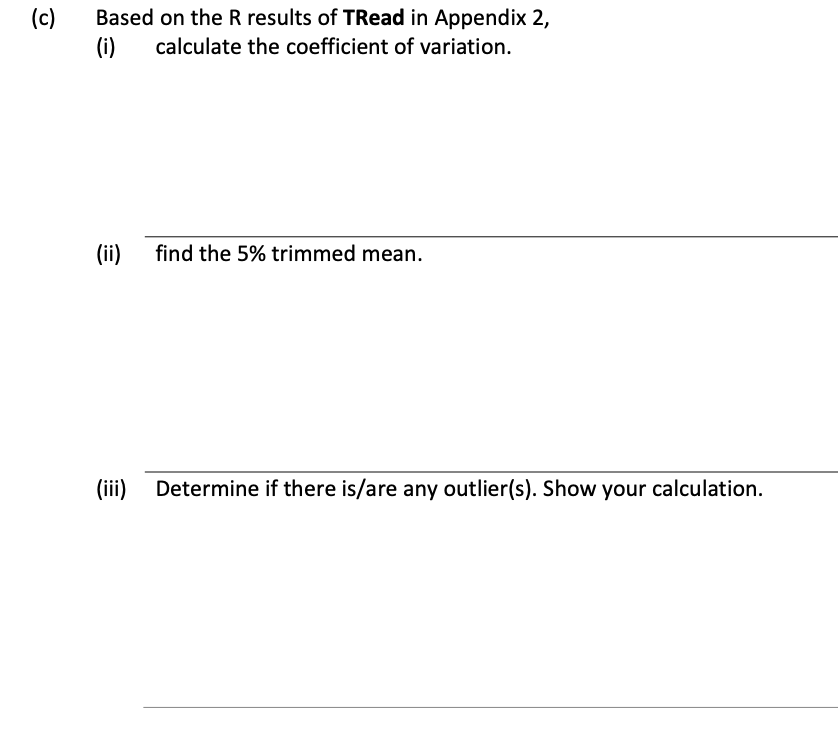
(c) Based on the R results of TRead in Appendix 2, (i) calculate the coefficient of variation. (ii) find the 5% trimmed mean. (iii) Determine
Step by Step Solution
There are 3 Steps involved in it
Step: 1

Get Instant Access to Expert-Tailored Solutions
See step-by-step solutions with expert insights and AI powered tools for academic success
Step: 2

Step: 3
Ace Your Homework with AI
Get the answers you need in no time with our AI-driven, step-by-step assistance
Get Started
Linear Algebra with Applications
Authors: Steven J. Leon
7th edition
131857851, 978-0131857858