

Question
c. Calculate the return on invested capital (ROIC=NOPAT/Total net operating capital) and the growth rate in free cash flow. What is the ROIC in the
| c. Calculate the return on invested capital (ROIC=NOPAT/Total net operating capital) and the growth rate in free cash flow. What is the ROIC in the last year of the forecast? What is the long-term constant growth rate in free cash flow (gL is the growth rate in FCF in the last forecast period because all ratios are constant)? Do you think that Hensley's value would increase if it could add growth without reducing its ROIC? (Hint: Growth will add value if the ROIC > WACC/[1+WACC]). Do you think that the company will have a value of operations greater than its total net operating capital? (Hint: Is ROIC > WACC/[1+gL]?) | ||||
| Actual | Projected | Projected | ||
| 2018/12/31 | 12/31/19 | 12/31/22 | ||
| Return on invested capital |
|
|
| |
| (ROIC=NOPAT/[Total net operating capital]) |
|
|
| |
| Weighted average cost of capital (WACC) | 10.5% | 10.5% | 10.5% | |
| Long-term constant growth in FCF (gL) |
| na |
| |
| WACC/(1+gL) |
| na |
| |
| WACC/(1+WACC) |
| na |
| |
| d. Calculate the current value of operations as of 12/31/2018. (Hint: First calculate the horizon value at the end of the forecast period, which is equal to the value of operations at the end of the forecast period. Assume that the annual growth rate beyond the horizon is equal to the growth rate in FCF at the horizon.) How does the current value of operations compare with the current amount of total net operating capital? | ||||
| Weighted average cost of capital (WACC) | 10.5% |
|
| |
|
|
|
|
| |
| Actual | Projected | Projected | ||
| 2018/12/31 | 12/31/19 | 12/31/22 | ||
| Free cash flow |
|
| ||
| Long-term constant growth in FCF (gL) |
| |||
| Horizon value |
|
|
| |
|
|
|
| ||
| Present value of horizon value - PV0(HV4) |
|
| ||
| Present value of forecasted FCF [PV0(FCF1 to 4)] |
|
| ||
| Value of operations ([PV0(HV4)] + [PV0(FCF1 to 4)]) |
|
| ||
|
|
|
|
| |
| Total net operating capital |
|
|
| |
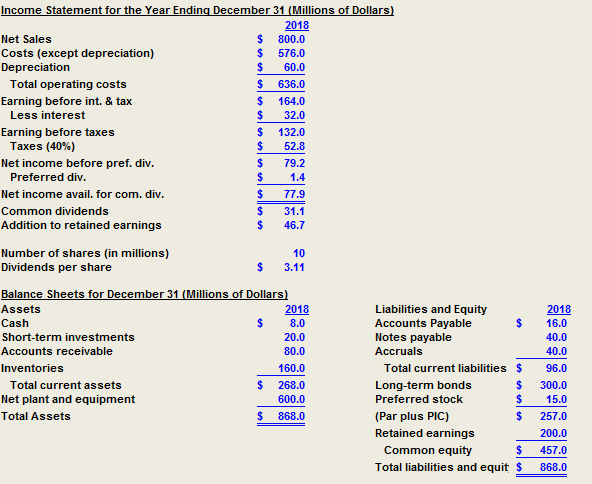
Income Statement for the Year Ending December 31 (Millions of Dollars) 2018 S Net Sales 800.0 Costs (except depreciation) Depreciation S 576.0 S 60.0 Total operating costs S 636.0 S Earning before int. & tax 164.0 S Less interest 32.0 Earning before taxes Taxes (40%) 132.0 52.8 S Net income before pref. div. 79.2 Preferred div. 1.4 Net income avail. for com. div. 77.9 S Common dividends 31.1 Addition to retained earnings 46.7 Number of shares (in millions) Dividends per share 10 3.11 Balance Sheets for December 31 (Millions of Dollars) Liabilities and Equity Accounts Payable Notes payable Assets 2018 2018 Cash 8.0 16.0 Short-term investments 20.0 40.0 80.0 Accounts receivable Accruals 40.0 Inventories 160.0 Total current liabilities $ 96.0 S Total current assets 268.0 Long-term bonds 300.0 Net plant and equipment 15.0 600.0 Preferred stock (Par plus PIC) S Total Assets 868.0 257.0 Retained earnings 200.0 S Common equity 457.0 Total liabilities and equit $ 868.0 Projected ratios and selected information for the current and projected years are shown below. Inputs Actual Projected Projected 2018/12/31 Projected Projected 12/31/21 12/31/19 12/31/20 12/31/22 Sales Growth Rate 15% 10% 6% 6% Costs/Sales 72% 72% 72% 72% 72% Depreciation/(Net PPE) 10% 10% 10% 10% 10% Cash/Sales 1% 1% 1% 1% 1% (Acct. Rec.)/Sales 10% 10% 10% 10% 10% Inventories/Sales 20% 20% 20% 20% 20% (Net PPE)/Sales (Acct. Pay.)/Sales 75% 75% 75% 75% 75% 2% 2% 2% 2% 2% Accruals/Sales 5% 5% 5% 5% 5% Tax rate 40% 40% 40% 40% 40% |Weighted average cost of capital (WACC) 10.5% 10.5% 10.5% 10.5% 10.5% Income Statement for the Year Ending December 31 (Millions of Dollars) 2018 S Net Sales 800.0 Costs (except depreciation) Depreciation S 576.0 S 60.0 Total operating costs S 636.0 S Earning before int. & tax 164.0 S Less interest 32.0 Earning before taxes Taxes (40%) 132.0 52.8 S Net income before pref. div. 79.2 Preferred div. 1.4 Net income avail. for com. div. 77.9 S Common dividends 31.1 Addition to retained earnings 46.7 Number of shares (in millions) Dividends per share 10 3.11 Balance Sheets for December 31 (Millions of Dollars) Liabilities and Equity Accounts Payable Notes payable Assets 2018 2018 Cash 8.0 16.0 Short-term investments 20.0 40.0 80.0 Accounts receivable Accruals 40.0 Inventories 160.0 Total current liabilities $ 96.0 S Total current assets 268.0 Long-term bonds 300.0 Net plant and equipment 15.0 600.0 Preferred stock (Par plus PIC) S Total Assets 868.0 257.0 Retained earnings 200.0 S Common equity 457.0 Total liabilities and equit $ 868.0 Projected ratios and selected information for the current and projected years are shown below. Inputs Actual Projected Projected 2018/12/31 Projected Projected 12/31/21 12/31/19 12/31/20 12/31/22 Sales Growth Rate 15% 10% 6% 6% Costs/Sales 72% 72% 72% 72% 72% Depreciation/(Net PPE) 10% 10% 10% 10% 10% Cash/Sales 1% 1% 1% 1% 1% (Acct. Rec.)/Sales 10% 10% 10% 10% 10% Inventories/Sales 20% 20% 20% 20% 20% (Net PPE)/Sales (Acct. Pay.)/Sales 75% 75% 75% 75% 75% 2% 2% 2% 2% 2% Accruals/Sales 5% 5% 5% 5% 5% Tax rate 40% 40% 40% 40% 40% |Weighted average cost of capital (WACC) 10.5% 10.5% 10.5% 10.5% 10.5%
Step by Step Solution
There are 3 Steps involved in it
Step: 1

Get Instant Access to Expert-Tailored Solutions
See step-by-step solutions with expert insights and AI powered tools for academic success
Step: 2

Step: 3
Ace Your Homework with AI
Get the answers you need in no time with our AI-driven, step-by-step assistance
Get Started
Financial Whirlpools A Systems Story Of The Great Global Recession
Authors: Karen L. Higgins
1st Edition
0124059058,012405921X