Answered step by step
Verified Expert Solution
Link Copied!

Question

1 Approved Answer

C Condensed balance sheet and income statement data for Jergan Corporation are presented here. Jergan Corporation Balance Sheets December 31 2020 2019 2018 Cash $30,100

image text in transcribed
C Condensed balance sheet and income statement data for Jergan Corporation are presented here. Jergan Corporation Balance Sheets December 31 2020 2019 2018 Cash $30,100 $16,100 $18,300 Accounts receivable (net) 49,800 45,500 47,900 Other current assets 89,600 95,000 63,000 Investments 55,100 70,000 46,000 Plant and equipment (net) 500,100 370,800 358,600 $724,700 $597,400 $533,800 Current liabilities $84,500 $79,400 $69,700 Long-term debt 145,700 84,300 50,700 Common stock, $10 par 319,000 381,000 306,000 Retained earnings 113,500 114,700 107,400 $724,700 $597,400 $533,800 Jergan Corporation Income Statement For the Years Ended December 31 2020 2019 Sales revenue $744,500 $605,400 Less: Sales returns and allowances 39,200 30,700 Net sales 705,300 574,700 Cost of goods sold 424,700 366,000 Gross profit 280,600 208,700 Operating expenses (including income taxes) 188,911 151,230 Net income $91,689 57,470 Additional information: 1. The market price of Jergan's common stock was $7.00, $7.50, and $8.50 f and 2020, respectively. 2. You must compute dividends paid. All dividends were paid in cash. 2018, 2019, CA Additional information: 1. The market price of Jergan's common stock was $7.00, $7.50, and $8.50 for 2018, 2019 and 2020, respectively. 2. You must compute dividends paid. All dividends were paid in cash. (a) Compute the following ratios for 2019 and 2020. (Round Asset turnover and Earnings per share to 2 decimal places, e.g. 1.65. Round payout ratio and debt to assets ratio to 0 decimal places, e.g. 18%. Round all other answers to 1 decimal place, e.g. 6.8 or 6.8%.) 2019 2020 (1) Profit margin 10% 13 % (2) Gross profit rate 36.3% 39.8 % (3) Asset turnover 1.02 times 1.07 times (4) Earnings per share 1.80 2.41 (5) Price-earnings ratio 4.2 times 4 times (6) Payout ratio 87.3 % 101.3 % (7) Debt to assets ratio 27.4% 31.8% SHOW SOLUTION LINK VIDEO: SIMILAR PROBLEM X

Step by Step Solution

There are 3 Steps involved in it

Step: 1

blur-text-image

Get Instant Access to Expert-Tailored Solutions

See step-by-step solutions with expert insights and AI powered tools for academic success

Step: 2

blur-text-image

Step: 3

blur-text-image

Ace Your Homework with AI

Get the answers you need in no time with our AI-driven, step-by-step assistance

Get Started

Recommended Textbook for

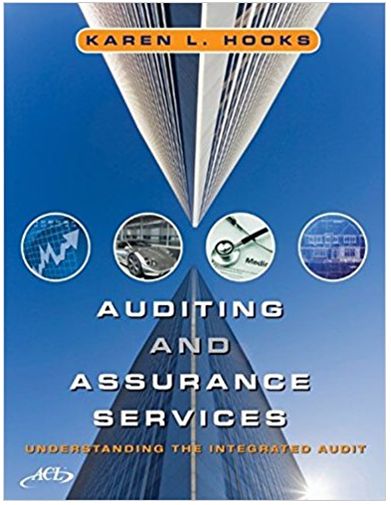
Auditing and Assurance Services Understanding the Integrated Audit

Authors: Karen L. Hooks

1st edition

471726346, 978-0471726340

More Books

Students also viewed these Accounting questions

Question

Explain the factors influencing wage and salary administration.

Answered: 1 week ago

Question

Examine various types of executive compensation plans.

Answered: 1 week ago

Question

1. What is the meaning and definition of banks ?

Answered: 1 week ago