Answered step by step
Verified Expert Solution
Question
1 Approved Answer
C. Data Analysis: Statistical and graphical interpretation of tabular data. t (s) V1 (m) ya (m) Va (m) ya (m) y:(m) Vavg ON 1 0.00
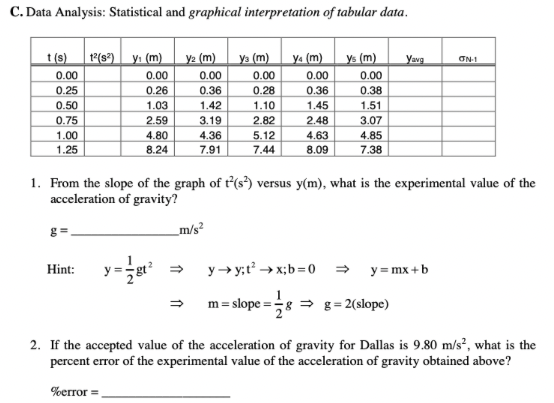
C. Data Analysis: Statistical and graphical interpretation of tabular data. t (s) V1 (m) ya (m) Va (m) ya (m) y:(m) Vavg ON 1 0.00 0.00 0.00 0.00 0.00 0.00 0.25 0.26 0.36 0.28 0.36 0.38 0.50 1.03 1.42 1.10 1.45 1.51 0.75 2.59 3.19 2.82 2.48 3.07 1.00 4.80 4.36 5.12 4.63 4.85 1.25 8.24 7.91 7.44 8.09 7.38 1. From the slope of the graph of t'(s ) versus y(m), what is the experimental value of the acceleration of gravity? m/$2 Hint: y yayt- x;b=0 = y = mx +b m = slope = = = g= 2(slope) N 2. If the accepted value of the acceleration of gravity for Dallas is 9.80 m/s', what is the percent error of the experimental value of the acceleration of gravity obtained above? "%error =
Step by Step Solution
There are 3 Steps involved in it
Step: 1
Get Instant Access to Expert-Tailored Solutions
See step-by-step solutions with expert insights and AI powered tools for academic success
Step: 2
Step: 3
Ace Your Homework with AI
Get the answers you need in no time with our AI-driven, step-by-step assistance
Get Started