

Question
C++ (DEVCPP) In this lab, you must read the data from a file. The input data file.You can just make the data file with a
| C++ (DEVCPP) |
In this lab, you must read the data from a file.
The input data file.You can just make the data file with a text editor. This small file contains the numbers: 2000 4000 5000 9000 14000 18000. Use the file people.txt.
You program can assume:
1) population numbers start for the year 1900;
2) population counts are provided in 20 year increments;
3) there are 6 population counts provided. To start out with working code which does most of what you need to read data from a file.
Steps for this lab:
1) Read the file people.txt. If the file is not found, handle the situation appropriately with a good error message, including the name of the file not found. Do not attempt to display a chart if no data is available. If the file opens OK, then use the data to display a bar chart showing population growth.
2) At the top of the chart, display a title at the top, so the user knows what this chart represents. For example, display: PRAIRIEVILLE POPULATION GROWTH (each * represents 1000 people)
3) Make the program more flexible: read population values from the file until end-of-file (instead of 6 times). This allow for more or fewer population data counts in the file. For example, it should also work if extra population values added for years 2020, 2040. Handle up to 10 population values.
Example output: (bar chart)
PRAIRIEVILLE POPULATION GROWTH (each * represents 1000 people) 1900 ** 1920 **** 1940 ***** 1960 *** 1980 ******* 2000 ******** 2020 ************ 2040 **********
4)Produce a column chart rather than a bar chart. That is, put the years along the bottom row, and have columns going up from the year. Make the column 2 stars wide centered over the year. You may use various techniques to do the column chart. You can use arrays if you like.
For a nicer column chart, include data markers: year values along the x-axis AND population values along the y-axis .
Example output: (column chart with data markers) PRAIRIEVILLE POPULATION GROWTH
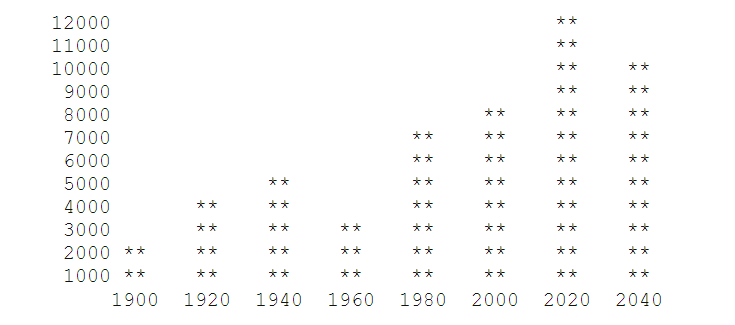
12000 11000 10000 9000 8000 7000 6000 5000 4000 3000 2000 ** 1000 * 1900 1920 1940 1960 1980 2000 2020 2040
Step by Step Solution
There are 3 Steps involved in it
Step: 1

Get Instant Access to Expert-Tailored Solutions
See step-by-step solutions with expert insights and AI powered tools for academic success
Step: 2

Step: 3
Ace Your Homework with AI
Get the answers you need in no time with our AI-driven, step-by-step assistance
Get Started
Expert Oracle Database Architecture
Authors: Thomas Kyte, Darl Kuhn
3rd Edition
1430262990, 9781430262992