

Question: C++ is preferred but not mandatory, thank you! (will thumbs up answer) REPORT NOT NEEDED BUT INCLUDED TO MAKE ASSIGNMENT MORE CLEAR. ONLY NEED PROGRAM
C++ is preferred but not mandatory, thank you! (will thumbs up answer)
 REPORT NOT NEEDED BUT INCLUDED TO MAKE ASSIGNMENT MORE CLEAR. ONLY NEED PROGRAM PLEASE.
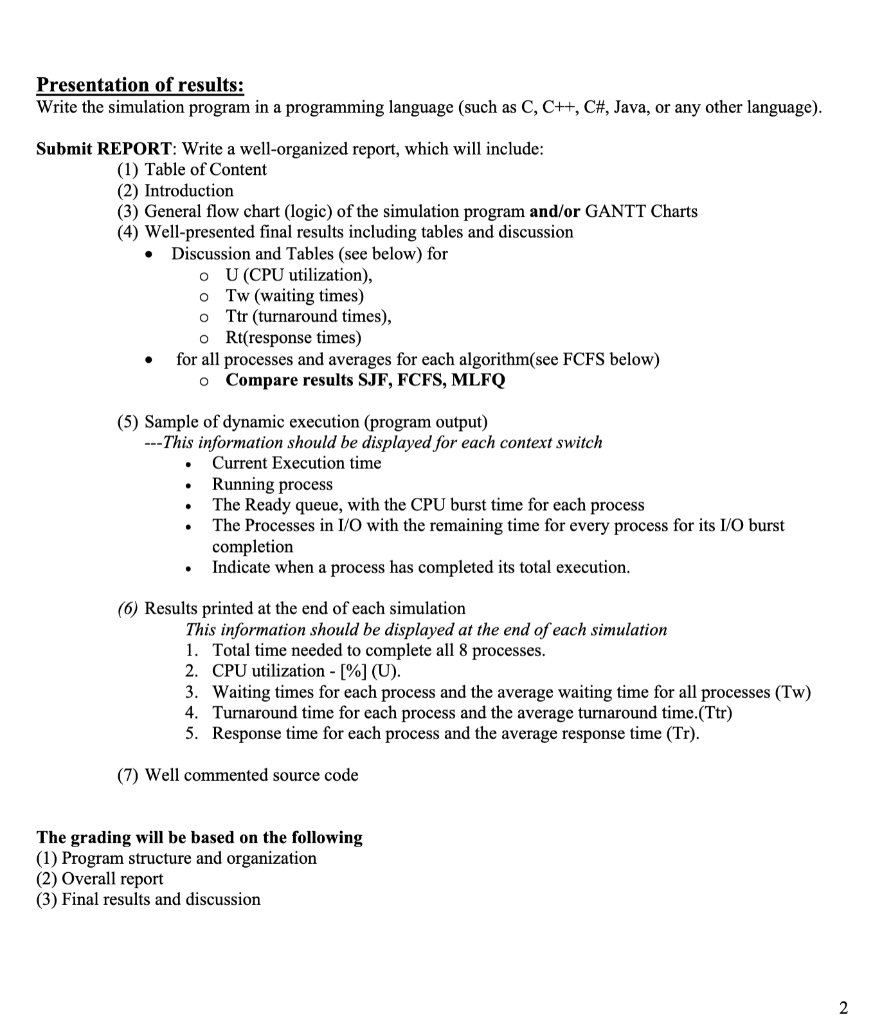
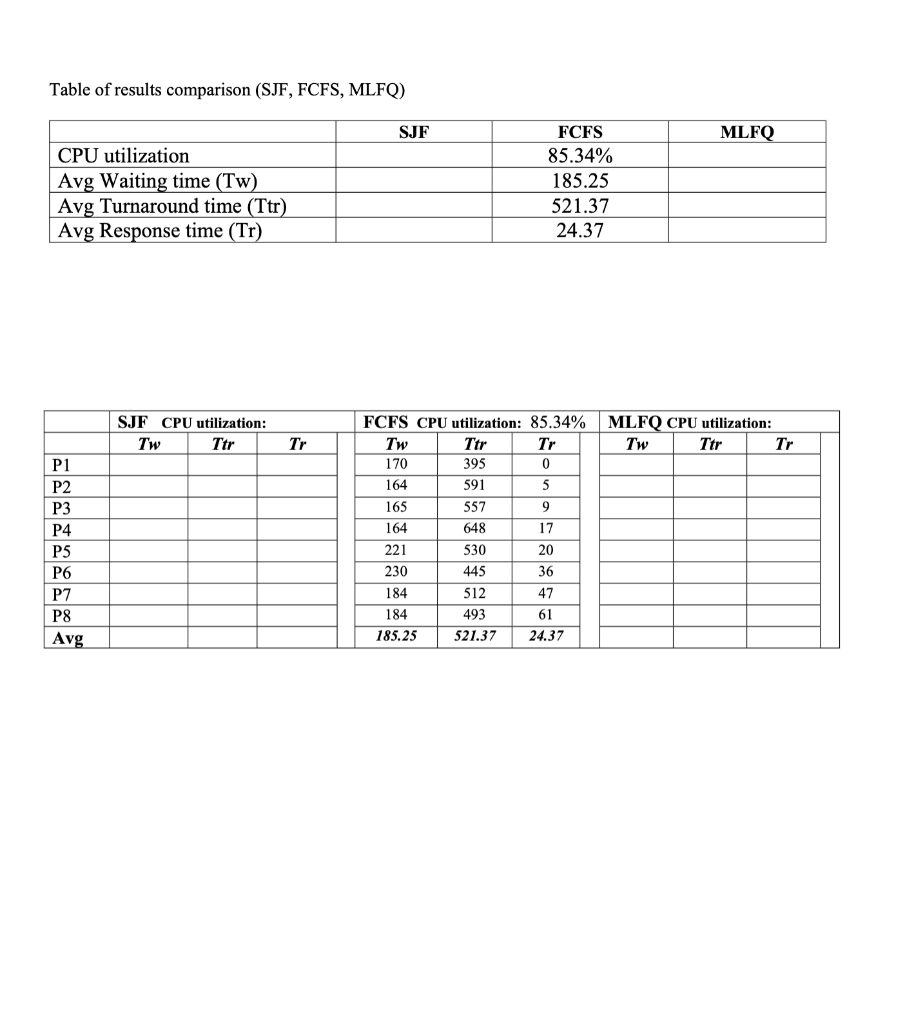
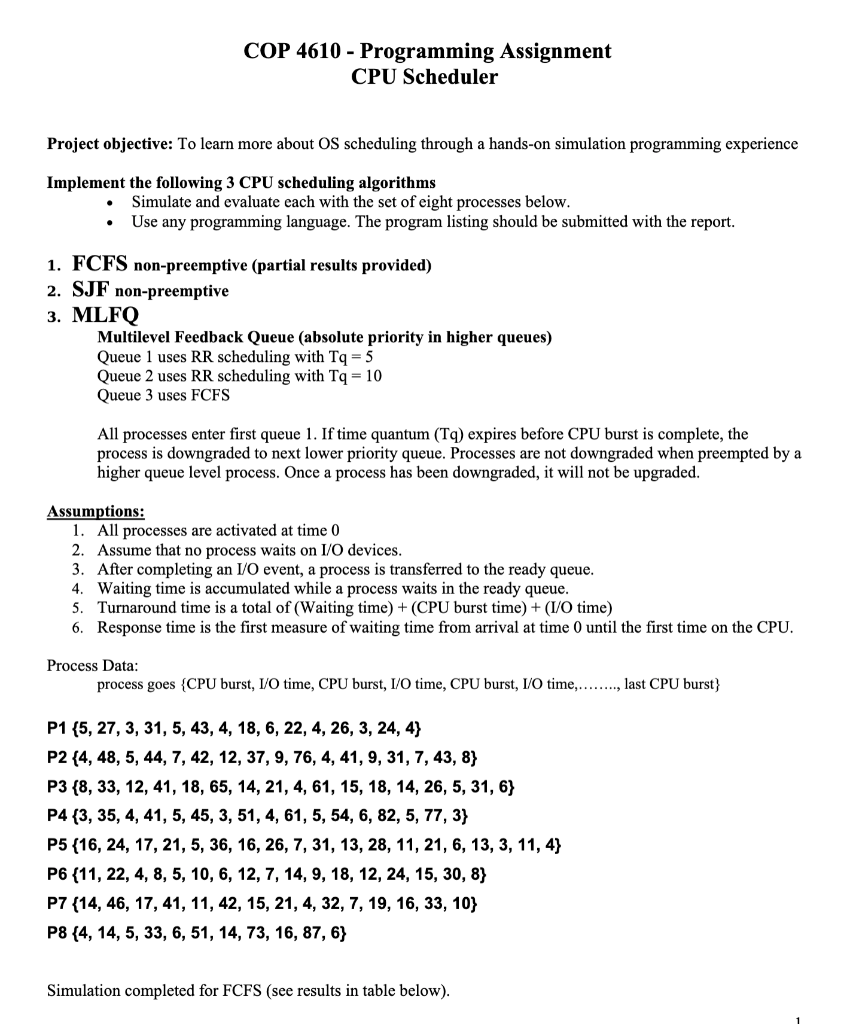
COP 4610 - Programming Assignment CPU Scheduler Project objective: To learn more about OS scheduling through a hands-on simulation programming experience Implement the following 3 CPU scheduling algorithms Simulate and evaluate each with the set of eight processes below. Use any programming language. The program listing should be submitted with the report. 1. FCFS non-preemptive (partial results provided) 2. SJF non-preemptive 3. MLFQ Multilevel Feedback Queue (absolute priority in higher queues) Queue 1 uses RR scheduling with Tq = 5 Queue 2 uses RR scheduling with Tq = 10 Queue 3 uses FCFS All processes enter first queue 1. If time quantum (Tq) expires before CPU burst is complete, the process is downgraded to next lower priority queue. Processes are not downgraded when preempted by a higher queue level process. Once a process has been downgraded, it will not be upgraded. Assumptions: 1. All processes are activated at time 0 2. Assume that no process waits on I/O devices. 3. After completing an I/O event, a process is transferred to the ready queue. 4. Waiting time is accumulated while a process waits in the ready queue. 5. Turnaround time is a total of (Waiting time) + (CPU burst time) + (I/O time) 6. Response time is the first measure of waiting time from arrival at time 0 until the first time on the CPU. Process Data: process goes {CPU burst, I/O time, CPU burst, I/O time, CPU burst, 1/0 time........., last CPU burst P1 {5, 27, 3, 31, 5, 43, 4, 18, 6, 22, 4, 26, 3, 24, 4) P2 {4, 48, 5, 44, 7, 42, 12, 37, 9, 76, 4, 41, 9, 31, 7, 43, 8} P3 (8, 33, 12, 41, 18, 65, 14, 21, 4, 61, 15, 18, 14, 26, 5, 31, 6} P4 {3, 35, 4, 41, 5, 45, 3, 51, 4, 61, 5, 54, 6, 82, 5, 77, 3} P5 {16, 24, 17, 21, 5, 36, 16, 26, 7, 31, 13, 28, 11, 21, 6, 13, 3, 11,4} P6 {11, 22, 4, 8, 5, 10, 6, 12, 7, 14, 9, 18, 12, 24, 15, 30, 8} P7 {14, 46, 17, 41, 11, 42, 15, 21, 4, 32, 7, 19, 16, 33, 10} P8 {4, 14, 5, 33, 6, 51, 14, 73, 16, 87, 6} Simulation completed for FCFS (see results in table below). Presentation of results: Write the simulation program in a programming language (such as C, C++, C#, Java, or any other language). Submit REPORT: Write a well-organized report, which will include: (1) Table of Content (2) Introduction (3) General flow chart (logic) of the simulation program and/or GANTT Charts (4) Well-presented final results including tables and discussion Discussion and Tables (see below) for O U (CPU utilization), Tw (waiting times) Ttr (turnaround times), o Rt(response times) for all processes and averages for each algorithm(see FCFS below) O Compare results SJF, FCFS, MLFO (5) Sample of dynamic execution (program output) ---This information should be displayed for each context switch Current Execution time Running process The Ready queue, with the CPU burst time for each process The Processes in I/O with the remaining time for every process for its I/O burst completion Indicate when a process has completed its total execution. (6) Results printed at the end of each simulation This information should be displayed at the end of each simulation 1. Total time needed to complete all 8 processes. 2. CPU utilization - [%] (U). 3. Waiting times for each process and the average waiting time for all processes (Tw) 4. Turnaround time for each process and the average turnaround time.(Ttr) 5. Response time for each process and the average response time (Tr). (7) Well commented source code The grading will be based on the following (1) Program structure and organization (2) Overall report (3) Final results and discussion Table of results comparison (SJF, FCFS, MLFQ) SJF MLFQ CPU utilization Avg Waiting time (Tw) Avg Turnaround time (Ttr) Avg Response time (Tr) FCFS 85.34% 185.25 521.37 24.37 SJF CPU utilization: TwTtrI | P1 P2 P3 P4 P5 P6 P7 FCFS CPU utilization: 85.34% MLFQ CPU utilization: Tw | Ttr | Tr || Tw | Ttr | Tr 170 395 164 591 165 5579 164 648 17 221 530 230 445 36 47 P8 184 184 185.25 512 493 521.37 Avg 24.37 COP 4610 - Programming Assignment CPU Scheduler Project objective: To learn more about OS scheduling through a hands-on simulation programming experience Implement the following 3 CPU scheduling algorithms Simulate and evaluate each with the set of eight processes below. Use any programming language. The program listing should be submitted with the report. 1. FCFS non-preemptive (partial results provided) 2. SJF non-preemptive 3. MLFQ Multilevel Feedback Queue (absolute priority in higher queues) Queue 1 uses RR scheduling with Tq = 5 Queue 2 uses RR scheduling with Tq = 10 Queue 3 uses FCFS All processes enter first queue 1. If time quantum (Tq) expires before CPU burst is complete, the process is downgraded to next lower priority queue. Processes are not downgraded when preempted by a higher queue level process. Once a process has been downgraded, it will not be upgraded. Assumptions: 1. All processes are activated at time 0 2. Assume that no process waits on I/O devices. 3. After completing an I/O event, a process is transferred to the ready queue. 4. Waiting time is accumulated while a process waits in the ready queue. 5. Turnaround time is a total of (Waiting time) + (CPU burst time) + (I/O time) 6. Response time is the first measure of waiting time from arrival at time 0 until the first time on the CPU. Process Data: process goes {CPU burst, I/O time, CPU burst, I/O time, CPU burst, 1/0 time........., last CPU burst P1 {5, 27, 3, 31, 5, 43, 4, 18, 6, 22, 4, 26, 3, 24, 4) P2 {4, 48, 5, 44, 7, 42, 12, 37, 9, 76, 4, 41, 9, 31, 7, 43, 8} P3 (8, 33, 12, 41, 18, 65, 14, 21, 4, 61, 15, 18, 14, 26, 5, 31, 6} P4 {3, 35, 4, 41, 5, 45, 3, 51, 4, 61, 5, 54, 6, 82, 5, 77, 3} P5 {16, 24, 17, 21, 5, 36, 16, 26, 7, 31, 13, 28, 11, 21, 6, 13, 3, 11,4} P6 {11, 22, 4, 8, 5, 10, 6, 12, 7, 14, 9, 18, 12, 24, 15, 30, 8} P7 {14, 46, 17, 41, 11, 42, 15, 21, 4, 32, 7, 19, 16, 33, 10} P8 {4, 14, 5, 33, 6, 51, 14, 73, 16, 87, 6} Simulation completed for FCFS (see results in table below). Presentation of results: Write the simulation program in a programming language (such as C, C++, C#, Java, or any other language). Submit REPORT: Write a well-organized report, which will include: (1) Table of Content (2) Introduction (3) General flow chart (logic) of the simulation program and/or GANTT Charts (4) Well-presented final results including tables and discussion Discussion and Tables (see below) for O U (CPU utilization), Tw (waiting times) Ttr (turnaround times), o Rt(response times) for all processes and averages for each algorithm(see FCFS below) O Compare results SJF, FCFS, MLFO (5) Sample of dynamic execution (program output) ---This information should be displayed for each context switch Current Execution time Running process The Ready queue, with the CPU burst time for each process The Processes in I/O with the remaining time for every process for its I/O burst completion Indicate when a process has completed its total execution. (6) Results printed at the end of each simulation This information should be displayed at the end of each simulation 1. Total time needed to complete all 8 processes. 2. CPU utilization - [%] (U). 3. Waiting times for each process and the average waiting time for all processes (Tw) 4. Turnaround time for each process and the average turnaround time.(Ttr) 5. Response time for each process and the average response time (Tr). (7) Well commented source code The grading will be based on the following (1) Program structure and organization (2) Overall report (3) Final results and discussion Table of results comparison (SJF, FCFS, MLFQ) SJF MLFQ CPU utilization Avg Waiting time (Tw) Avg Turnaround time (Ttr) Avg Response time (Tr) FCFS 85.34% 185.25 521.37 24.37 SJF CPU utilization: TwTtrI | P1 P2 P3 P4 P5 P6 P7 FCFS CPU utilization: 85.34% MLFQ CPU utilization: Tw | Ttr | Tr || Tw | Ttr | Tr 170 395 164 591 165 5579 164 648 17 221 530 230 445 36 47 P8 184 184 185.25 512 493 521.37 Avg 24.37
Step by Step Solution
There are 3 Steps involved in it

Get step-by-step solutions from verified subject matter experts