Answered step by step
Verified Expert Solution
Link Copied!

Question

1 Approved Answer

c. may {1. 3.53 1 A researcher studies the average number of children per household in three different cities. He studies Seattle; Phoenix, and Los

image text in transcribed
c. may {1. 3.53 1 A researcher studies the average number of children per household in three different cities. He studies Seattle; Phoenix, and Los Angeles with 1|} families from each of these clties {data below}. Use an ANDUA to determine if these cities are statisti tally different from each other in terms of children per household. Use an alpha of .01.. ii = 3. N = 30. G = 50. III? = 206 Sum of Scores Number Total mnm E \"mm a. Write a null hypothesis and alternative hypothesis as notations and in how you would in "grandma's te rms.' b. Create an F Distribution graph and label the critical region with a critical F {alpha = .01]. \"n\" -m _-_ --i?w_agew Width c. Do you accept or reject the null hypothesis? Write a nal conclusion for this study in APA format

Step by Step Solution

There are 3 Steps involved in it

Step: 1

blur-text-image

Get Instant Access with AI-Powered Solutions

See step-by-step solutions with expert insights and AI powered tools for academic success

Step: 2

blur-text-image

Step: 3

blur-text-image

Ace Your Homework with AI

Get the answers you need in no time with our AI-driven, step-by-step assistance

Get Started

Recommended Textbook for

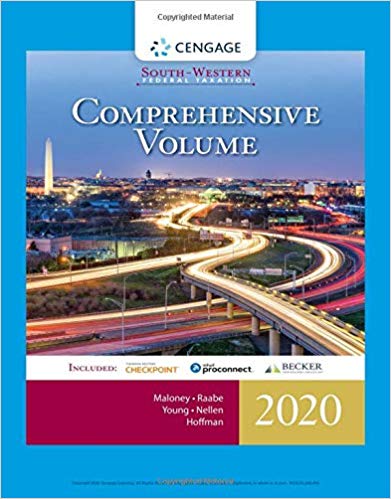
South-Western Federal Taxation 2020 Comprehensive

Authors: David M. Maloney, William A. Raabe, James C. Young, Annette Nellen, William H. Hoffman

43rd Edition

357109147, 978-0357109144

Students also viewed these Mathematics questions

Question

What are the role of supervisors ?

Answered: 1 week ago