C++ Programming
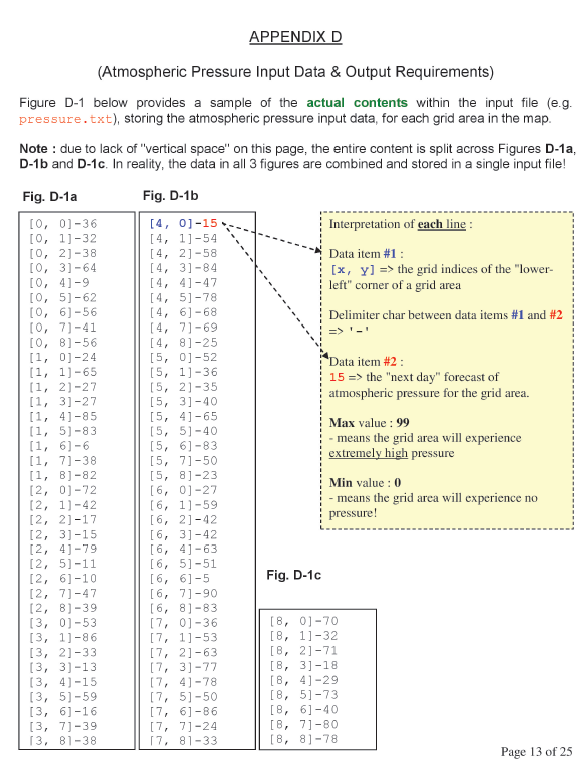
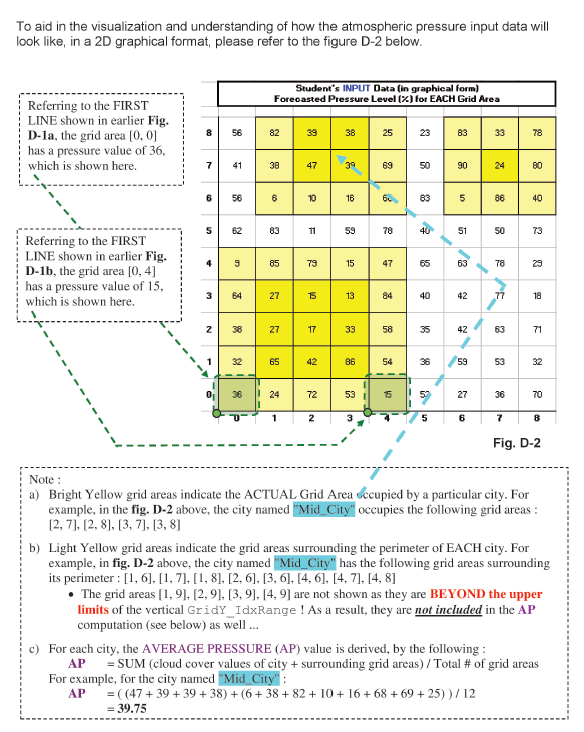
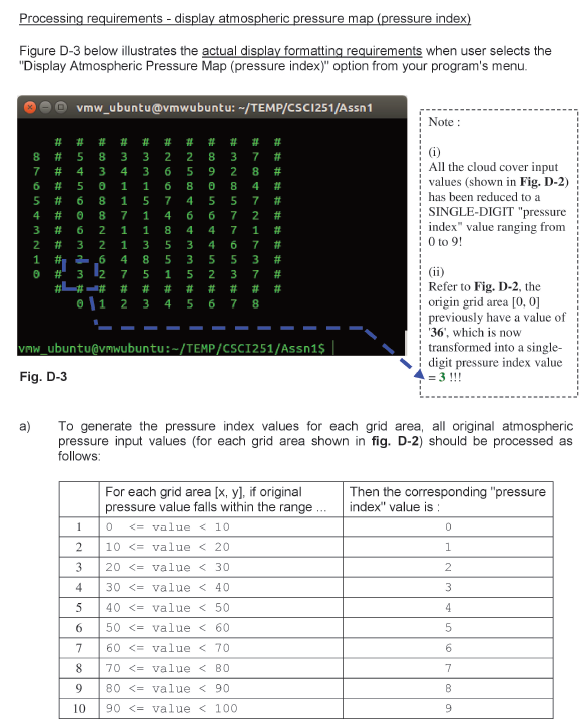
APPENDIX D (Atmospheric Pressure Input Data & Output Requirements) Figure D-1 below provides a sample of the actual contents within the input file (e.g. pressure.txt), storing the atmospheric pressure input data, for each grid area in the map. Note : due to lack of "vertical space" on this page, the entire content is split across Figures D-1a, D-1b and D-1c. In reality, the data in all 3 figures are combined and stored in a single input file! Fig. D-1a Fig. D-1b Interpretation of each line Data item #1 : [x, y] => the grid indices of the "lower- left" corner of a grid area Delimiter char between data items #1 and #2 [0, 0]-36 [0, 1]-32 [0, 2]-38 [0, 3)-64 [0, 4]-9 [0, 5] -62 [0, 6] -56 [0, 7] -41 [0, 8]-56 (1, 0)-24 [1, 1)-65 [1, 2]-27 [1, 3] -27 [1, 4]-85 [1, 5)-83 [1, 61-6 [1, 71-38 [1, B)-82 [2, 0)-72 [2, 1) -42 [2, 2]-17 [2, 3] -15 [2, 4] - 79 [2, 5)-11 [2, 6] -10 [2, 7)-47 [2, 8]-39 [3, 01-53 [3, 1)-86 [3, 2]-33 (3, 3)-13 [3, 4]-15 [3, 5)-59 [3, 6) -16 [3, 71-39 13, 81-38 [4, 01-15 [4, 1]-54 [4, 21-58 [4, 31-84 [4, 4]-47 [4, 5] -78 [4, 61-68 [4, 71-69 [4, 8] -25 [5, 00-52 [5, 1]-36 [5, 21-35 [5, 3] -40 [5, 4]-65 [5, 5] -40 [5, 6]-83 [5, 71-50 [5, 8] -23 [6, 01-27 [0, 1]-59 [6, 2]-42 [6, 3] -42 [6, 41-63 [6, 5]-51 [6, 6] -5 [6, 71-90 [6, 8]-83 [7, 0]-36 [7, 1]-53 [7, 2]-63 [7, 3] - 77 [7, 4]-78 [7, 5] -50 [7, 6] -86 [7, 7] -24 17, 81-33 Data item #2 : 15 => the "next day" forecast of atmospheric pressure for the grid area. Max value : 99 - means the grid area will experience extremely high pressure Min value: 0 means the grid area will experience no pressure! Fig. D-10 [8, 01-70 [8, 1]-32 [B, 2]-71 [B, 3]-18 [8, 41-29 [8, 5]-73 [B, 6] -40 [B, 71-80 [8, 8]-78 Page 13 of 25 To aid in the visualization and understanding of how the atmospheric pressure input data will look like, in a 2D graphical format, please refer to the figure D-2 below. Student's INPUT Data (in graphical form) Forecasted Pressure Level (%) for EACH Grid Area Referring to the FIRST LINE shown in earlier Fig. D-la, the grid area [0, 0] has a pressure value of 36, which is shown here. 56 82 39 3B 25 23 83 78 7 41 38 47 39 69 50 90 24 80 6 56 6 10 18 6 83 5 86 40 5 62 83 11 59 78 40 51 50 73 4 9 85 79 15 47 65 63 78 Referring to the FIRST LINE shown in earlier Fig. D-1b, the grid area (0,4) has a pressure value of 15, which is shown here. 3 64 27 15 13 84 40 42 77 18 N 38 27 17 33 58 35 42 63 71 A 1 32 65 42 86 54 36 59 53 32 36 72 53 1 6 5 27 36 70 1 2 3 5 6 7 8 Fig. D-2 Note : a) Bright Yellow grid areas indicate the ACTUAL Grid Area Sccupied by a particular city. For example, in the fig. D-2 above, the city named "Mid_City" occupies the following grid areas: [2, 7), [2, 8), (3, 7), (3, 8] b) Light Yellow grid areas indicate the grid areas surrounding the perimeter of EACH city. For example, in fig. D-2 above, the city named "Mid_City" has the following grid areas surrounding its perimeter : [1,6],[1, 7],[1, 8], [2, 6), (3,6], [4,6], [4, 7], [4, 8] The grid areas (1,9), (2,9), (3,9), [4, 9) are not shown as they are BEYOND the upper limits of the vertical Gridy_IdxRange! As a result, they are not included in the AP computation (see below) as well... c) For each city, the AVERAGE PRESSURE (AP) value is derived, by the following: AP = SUM (cloud cover values of city + surrounding grid areas) / Total # of grid areas For example, for the city named "Mid City": AP = ((47 +39 +39 +38) + (6 +38 +82 + 10 + 16 + 68 + 69 +25))/12 = 39.75 Processing requirements - display atmospheric pressure map (pressure index) Figure D-3 below illustrates the actual display formatting requirements when user selects the "Display Atmospheric Pressure Map (pressure index)" option from your program's menu. vmw_ubuntu@vmwubuntu: -/TEMP/CSC1251/Assn 1 Note: 8 7 5 4 3 2 1 ###### ### # # # # # # # # # 5 8 3 3 2 2 8 3 7 # 4 3 4 3 6 5 9 2 8 # 5 1 1 8 8 4 # 6 8 1 5 7 4 5 5 7 # 8 7 1 4 6 6 7 2 2 1 1 8 4 4 7 1 3 2 1 5 3 4 6 7 3.6 4 8 5 3 5 5 3 # 3 2 7 5 1 5 2 7 ### # # # # # # \1 2 3 4 5 6 7 8 #### (1) All the cloud cover input values (shown in Fig. D-2) has been reduced to a SINGLE-DIGIT "pressure index" value ranging from 0 to 9! Refer to Fig. D-2, the origin grid area [0, 0] previously have a value of '36', which is now transformed into a single- digit pressure index value = 3 !!! Vrw_ubuntu@vmwubuntu:-/TEMP/CSC1251/Assn1$|| Fig. D-3 a) To generate the pressure index values for each grid area, all original atmospheric pressure input values (for each grid area shown in fig. D-2) should be processed as follows: Then the corresponding pressure index" value is : 1 For each grid area (x, y), if original pressure value falls within the range ... the grid indices of the "lower- left" corner of a grid area Delimiter char between data items #1 and #2 [0, 0]-36 [0, 1]-32 [0, 2]-38 [0, 3)-64 [0, 4]-9 [0, 5] -62 [0, 6] -56 [0, 7] -41 [0, 8]-56 (1, 0)-24 [1, 1)-65 [1, 2]-27 [1, 3] -27 [1, 4]-85 [1, 5)-83 [1, 61-6 [1, 71-38 [1, B)-82 [2, 0)-72 [2, 1) -42 [2, 2]-17 [2, 3] -15 [2, 4] - 79 [2, 5)-11 [2, 6] -10 [2, 7)-47 [2, 8]-39 [3, 01-53 [3, 1)-86 [3, 2]-33 (3, 3)-13 [3, 4]-15 [3, 5)-59 [3, 6) -16 [3, 71-39 13, 81-38 [4, 01-15 [4, 1]-54 [4, 21-58 [4, 31-84 [4, 4]-47 [4, 5] -78 [4, 61-68 [4, 71-69 [4, 8] -25 [5, 00-52 [5, 1]-36 [5, 21-35 [5, 3] -40 [5, 4]-65 [5, 5] -40 [5, 6]-83 [5, 71-50 [5, 8] -23 [6, 01-27 [0, 1]-59 [6, 2]-42 [6, 3] -42 [6, 41-63 [6, 5]-51 [6, 6] -5 [6, 71-90 [6, 8]-83 [7, 0]-36 [7, 1]-53 [7, 2]-63 [7, 3] - 77 [7, 4]-78 [7, 5] -50 [7, 6] -86 [7, 7] -24 17, 81-33 Data item #2 : 15 => the "next day" forecast of atmospheric pressure for the grid area. Max value : 99 - means the grid area will experience extremely high pressure Min value: 0 means the grid area will experience no pressure! Fig. D-10 [8, 01-70 [8, 1]-32 [B, 2]-71 [B, 3]-18 [8, 41-29 [8, 5]-73 [B, 6] -40 [B, 71-80 [8, 8]-78 Page 13 of 25 To aid in the visualization and understanding of how the atmospheric pressure input data will look like, in a 2D graphical format, please refer to the figure D-2 below. Student's INPUT Data (in graphical form) Forecasted Pressure Level (%) for EACH Grid Area Referring to the FIRST LINE shown in earlier Fig. D-la, the grid area [0, 0] has a pressure value of 36, which is shown here. 56 82 39 3B 25 23 83 78 7 41 38 47 39 69 50 90 24 80 6 56 6 10 18 6 83 5 86 40 5 62 83 11 59 78 40 51 50 73 4 9 85 79 15 47 65 63 78 Referring to the FIRST LINE shown in earlier Fig. D-1b, the grid area (0,4) has a pressure value of 15, which is shown here. 3 64 27 15 13 84 40 42 77 18 N 38 27 17 33 58 35 42 63 71 A 1 32 65 42 86 54 36 59 53 32 36 72 53 1 6 5 27 36 70 1 2 3 5 6 7 8 Fig. D-2 Note : a) Bright Yellow grid areas indicate the ACTUAL Grid Area Sccupied by a particular city. For example, in the fig. D-2 above, the city named "Mid_City" occupies the following grid areas: [2, 7), [2, 8), (3, 7), (3, 8] b) Light Yellow grid areas indicate the grid areas surrounding the perimeter of EACH city. For example, in fig. D-2 above, the city named "Mid_City" has the following grid areas surrounding its perimeter : [1,6],[1, 7],[1, 8], [2, 6), (3,6], [4,6], [4, 7], [4, 8] The grid areas (1,9), (2,9), (3,9), [4, 9) are not shown as they are BEYOND the upper limits of the vertical Gridy_IdxRange! As a result, they are not included in the AP computation (see below) as well... c) For each city, the AVERAGE PRESSURE (AP) value is derived, by the following: AP = SUM (cloud cover values of city + surrounding grid areas) / Total # of grid areas For example, for the city named "Mid City": AP = ((47 +39 +39 +38) + (6 +38 +82 + 10 + 16 + 68 + 69 +25))/12 = 39.75 Processing requirements - display atmospheric pressure map (pressure index) Figure D-3 below illustrates the actual display formatting requirements when user selects the "Display Atmospheric Pressure Map (pressure index)" option from your program's menu. vmw_ubuntu@vmwubuntu: -/TEMP/CSC1251/Assn 1 Note: 8 7 5 4 3 2 1 ###### ### # # # # # # # # # 5 8 3 3 2 2 8 3 7 # 4 3 4 3 6 5 9 2 8 # 5 1 1 8 8 4 # 6 8 1 5 7 4 5 5 7 # 8 7 1 4 6 6 7 2 2 1 1 8 4 4 7 1 3 2 1 5 3 4 6 7 3.6 4 8 5 3 5 5 3 # 3 2 7 5 1 5 2 7 ### # # # # # # \1 2 3 4 5 6 7 8 #### (1) All the cloud cover input values (shown in Fig. D-2) has been reduced to a SINGLE-DIGIT "pressure index" value ranging from 0 to 9! Refer to Fig. D-2, the origin grid area [0, 0] previously have a value of '36', which is now transformed into a single- digit pressure index value = 3 !!! Vrw_ubuntu@vmwubuntu:-/TEMP/CSC1251/Assn1$|| Fig. D-3 a) To generate the pressure index values for each grid area, all original atmospheric pressure input values (for each grid area shown in fig. D-2) should be processed as follows: Then the corresponding pressure index" value is : 1 For each grid area (x, y), if original pressure value falls within the range ...