

Answered step by step
Verified Expert Solution
Question
1 Approved Answer
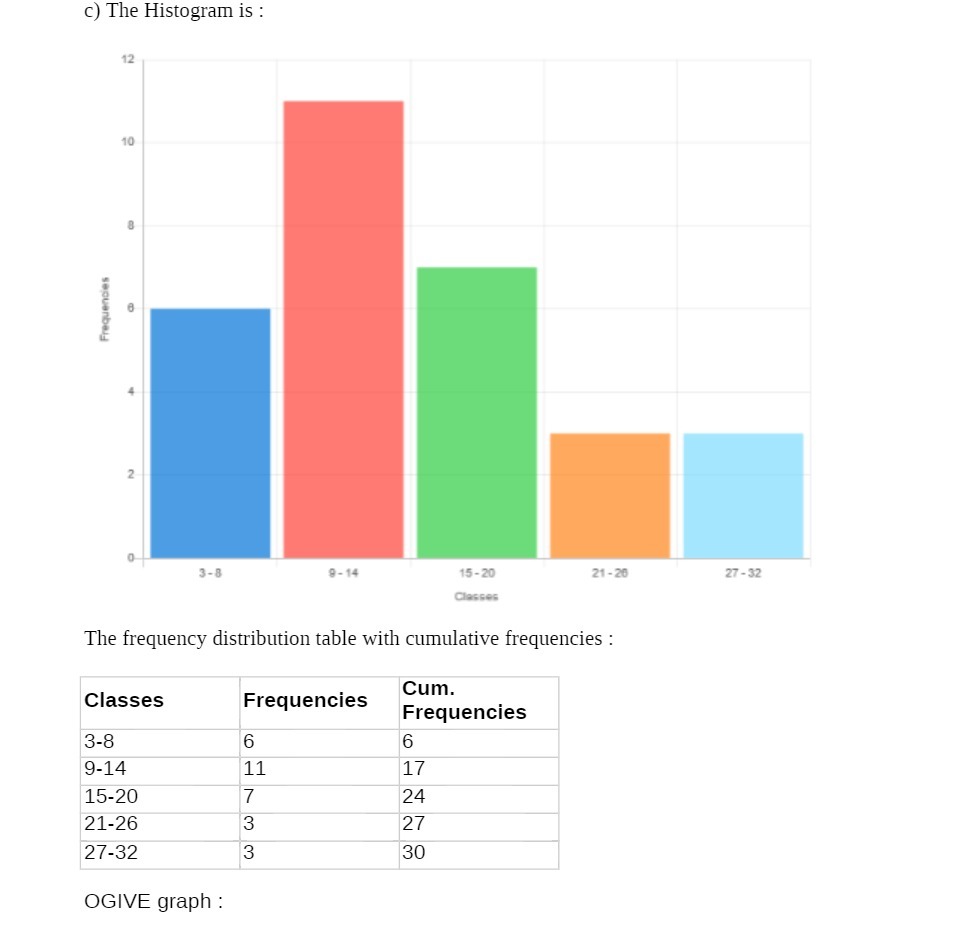
c) The Histogram is : 12 10 Frequencies 2 3-8 21 -20 27 - 32 Classes The frequency distribution table with cumulative frequencies : Classes

Step by Step Solution
There are 3 Steps involved in it
Step: 1

Get Instant Access to Expert-Tailored Solutions
See step-by-step solutions with expert insights and AI powered tools for academic success
Step: 2

Step: 3
Ace Your Homework with AI
Get the answers you need in no time with our AI-driven, step-by-step assistance
Get Started
The Real Numbers And Real Analysis
Authors: Ethan D Bloch
1st Edition
0387721770, 9780387721774