Answered step by step
Verified Expert Solution
Question
1 Approved Answer
c) Using the spreadsheet data in Table 1 given below with energy use and HDD by month for 2020, develop a scatter plot and

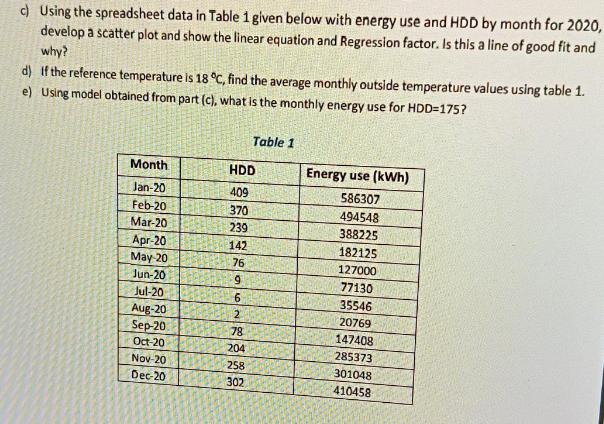
c) Using the spreadsheet data in Table 1 given below with energy use and HDD by month for 2020, develop a scatter plot and show the linear equation and Regression factor. Is this a line of good fit and why? d) If the reference temperature is 18 C, find the average monthly outside temperature values using table 1. e) Using model obtained from part (c), what is the monthly energy use for HDD=175? Month Jan-20 Feb-20 Mar-20 Apr-20 May-20 Jun-20 Jul-20 Aug-20 Sep-20 Oct-20 Nov-20 Dec-20 HDD 409 370 239 142 76 9 6 2 78 204 Table 1 258 302 Energy use (kWh) 586307 494548 388225 182125 127000 77130 35546 20769 147408 285373 301048 410458
Step by Step Solution
★★★★★
3.44 Rating (160 Votes )
There are 3 Steps involved in it
Step: 1
To perform the tasks described in parts c d and e we can use Microsoft Excel or any other spre...
Get Instant Access to Expert-Tailored Solutions
See step-by-step solutions with expert insights and AI powered tools for academic success
Step: 2

Step: 3

Ace Your Homework with AI
Get the answers you need in no time with our AI-driven, step-by-step assistance
Get Started


