

Question: c) Using your app or the decibel meter, measure the sound intensity at several locations and record them in Table 1. A few suggested locations
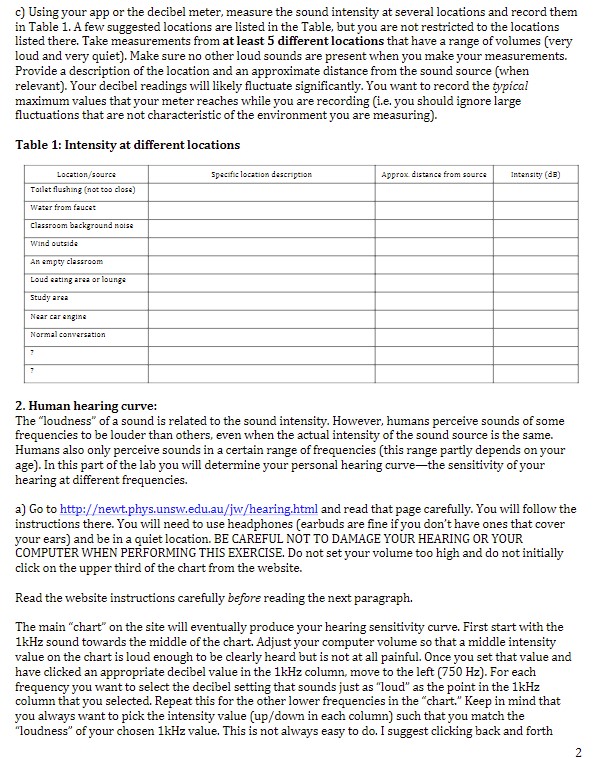
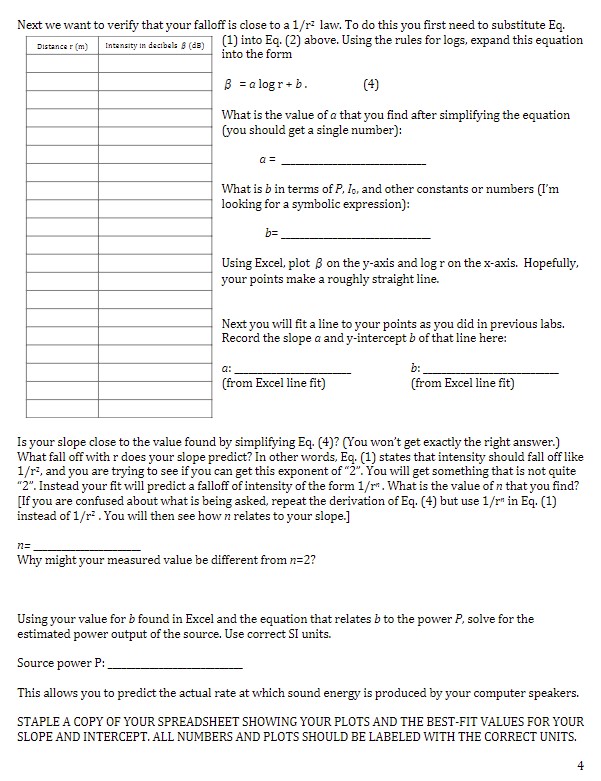
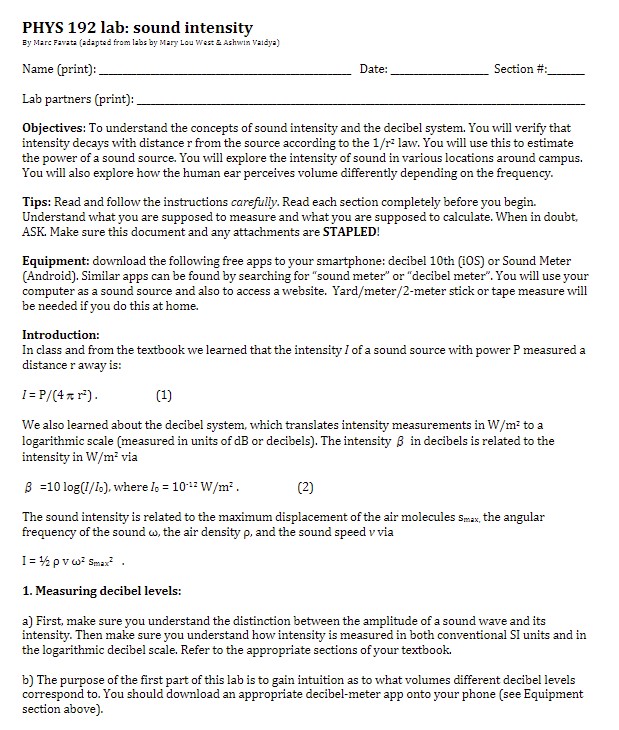
c) Using your app or the decibel meter, measure the sound intensity at several locations and record them in Table 1. A few suggested locations are listed in the Table, but you are not restricted to the locations listed there. Take measurements from at least 5 different locations that have a range of volumes (very loud and very quiet). Make sure no other loud sounds are present when you make your measurements. Provide a description of the location and an approximate distance from the sound source (when relevant). Your decibel readings will likely fluctuate significantly. You want to record the typical maximum values that your meter reaches while you are recording (i.e. you should ignore large fluctuations that are not characteristic of the environment you are measuring). Table 1: Intensity at different locations Location/source specific location description Approx. distance from source Intensity (dE) Toilet flushing (not too close) Water from faucet Classroom background noise Wind outside An empty classroom Loud eating area of lounge Study area Near car angina Normal conversation 2. Human hearing curve: The "loudness" of a sound is related to the sound intensity. However, humans perceive sounds of some frequencies to be louder than others, even when the actual intensity of the sound source is the same. Humans also only perceive sounds in a certain range of frequencies (this range partly depends on your age). In this part of the lab you will determine your personal hearing curve-the sensitivity of your hearing at different frequencies. a) Go to http:/ewt.phys.unsw.edu.au/jw/hearing.html and read that page carefully. You will follow the instructions there. You will need to use headphones (earbuds are fine if you don't have ones that cover your ears) and be in a quiet location. BE CAREFUL NOT TO DAMAGE YOUR HEARING OR YOUR COMPUTER WHEN PERFORMING THIS EXERCISE. Do not set your volume too high and do not initially click on the upper third of the chart from the website. Read the website instructions carefully before reading the next paragraph. The main "chart" on the site will eventually produce your hearing sensitivity curve. First start with the 1kHz sound towards the middle of the chart. Adjust your computer volume so that a middle intensity value on the chart is loud enough to be clearly heard but is not at all painful. Once you set that value and have clicked an appropriate decibel value in the 1kHz column, move to the left (750 Hz). For each frequency you want to select the decibel setting that sounds just as "loud" as the point in the 1kHz column that you selected. Repeat this for the other lower frequencies in the "chart." Keep in mind that you always want to pick the intensity value (up/down in each column) such that you match the "loudness" of your chosen 1kHz value. This is not always easy to do. I suggest clicking back and forth 2between the 1kiz value and several values in a given column to compare the relative loudness. Once you have moved all the way to the leftmost column, start moving rightward from the 1kHz column. When you are done, the highlighted points in the chart will indicate your hearing sensitivity curve. Right- click the chart and select print to print out a copy. (If you don't have a printer connected, save the chart as a pdf, do a screen capture, or leave the website open and print out the chart later.) STAPLE your printout to the back of your lab. Were you able to hear the sound at 16kHz? 3. Intensity vs. distance: In this part of the lab you will attempt to verify the 1/r: fall-off of sound intensity as predicted by Eq. 1. If you do this lab at home or using your laptop: begin by moving someplace where you will not annoy people or pets. (You will repeatedly play loud tones.) The procedure is simple. Go to the website you used in part 2 and select a single sound frequency and intensity value. In this case you will use your computer speakers-DO NOT USE HEADPHONES. You want to select a sound ~1 kHz and take several decibel readings at measured distances from your computer. You need to set the volume to be as loud as possible without damaging your computer, your hearing, or your sanity. If you set your sound to be too low, it will be difficult to get a good measurement. Good luck. Once you've selected a sound frequency and intensity/volume level, start up the decibel meter app you downloaded on your phone. Start by placing the microphone of your phone ~10-20 cm away from your computer speakers. Play the sound and record both the distance (convert to meters) and the decibel reading in Table 2. For this initial distance, it might be easiest to just measure the distance from the bottom of your laptop screen or other obvious reference point. The important thing is to measure all your distances from the same spot. When you play the sound, you should play it several times and record the maximum decibel value that your app reads. (It is important that there are no louder sounds in the room.) Then move your phone away from your speakers by 10 to 15 cm; record the new distance and repeat the procedure for finding the maximum decibel reading. (Make sure you are always playing the exact same sound frequency and intensity; do not adjust your computer volume once you begin). Repeat this several times. If the sound is not changing by a measureable amount, than you might select a different distance increment. You will need to be in a quiet room for this to work. Once you have filled in the table, or the sound no longer decreases below the background level (~ 30-40 dB for a very quiet room), stop taking measurements. You should have between 15 and 20 points recorded in Table 2. To analyze this data, enter it in two columns in Excel or a similar program (make sure your distance is in meters!). Make two more columns in the spreadsheet. In the first compute the log (base 10) of the distance in the corresponding row (convert to meters first and make sure you are using the correct Excel log function). In the second new column, convert your decibel measurements to intensity / in units of W/m: . To do this you will need to understand how to invert Eq. 2 above to solve for /. Make sure each column is labeled appropriately; keep your spreadsheet well organized and readable by your instructor. Now make an x-y plot (try the "straight marked scatter" type plot if using Excel) with your intensity (in W/m*2) on the y-axis and your distance (in m) on the x-axis. Do not connect the dots with lines. Does your plot look roughly like a plot of 1/ri ? If not, you might be doing something wrong. Staple this (properly labeled) plot with your lab.Next we want to verify that your falloff is close to a 1/ri law. To do this you first need to substitute Eq. Distance r (m) Intensity in decibels # (de) (1) into Eq. (2) above. Using the rules for logs, expand this equation into the form B = ologr+ b. (4) What is the value of a that you find after simplifying the equation (you should get a single number): 0 = What is b in terms of P, Jo, and other constants or numbers (I'm looking for a symbolic expression): b= Using Excel, plot B on the y-axis and log r on the x-axis. Hopefully, your points make a roughly straight line. Next you will fit a line to your points as you did in previous labs. Record the slope a and y-intercept b of that line here: a: b: (from Excel line fit) (from Excel line fit) Is your slope close to the value found by simplifying Eq. (4)? (You won't get exactly the right answer.) What fall off with r does your slope predict? In other words, Eq. (1) states that intensity should fall off like 1/r, and you are trying to see if you can get this exponent of "2". You will get something that is not quite "2". Instead your fit will predict a falloff of intensity of the form 1/r* . What is the value of n that you find? [If you are confused about what is being asked, repeat the derivation of Eq. (4) but use 1/r" in Eq. (1) instead of 1/ri . You will then see how n relates to your slope.] n= Why might your measured value be different from n=2? Using your value for b found in Excel and the equation that relates b to the power P, solve for the estimated power output of the source. Use correct SI units. Source power P: This allows you to predict the actual rate at which sound energy is produced by your computer speakers. STAPLE A COPY OF YOUR SPREADSHEET SHOWING YOUR PLOTS AND THE BEST-FIT VALUES FOR YOUR SLOPE AND INTERCEPT. ALL NUMBERS AND PLOTS SHOULD BE LABELED WITH THE CORRECT UNITS.PHYS 192 lab: sound intensity By Marc Favata (adapted from labs by Mary Lou West & Ashwin Vaidya) Name (print): Date: Section #: Lab partners (print): Objectives: To understand the concepts of sound intensity and the decibel system. You will verify that intensity decays with distance r from the source according to the 1/ri law. You will use this to estimate the power of a sound source. You will explore the intensity of sound in various locations around campus. You will also explore how the human ear perceives volume differently depending on the frequency. Tips: Read and follow the instructions carefully. Read each section completely before you begin. Understand what you are supposed to measure and what you are supposed to calculate. When in doubt, ASK. Make sure this document and any attachments are STAPLED! Equipment: download the following free apps to your smartphone: decibel 10th (105) or Sound Meter (Android). Similar apps can be found by searching for "sound meter" or "decibel meter". You will use your computer as a sound source and also to access a website. Yard/meter/2-meter stick or tape measure will be needed if you do this at home. Introduction: In class and from the textbook we learned that the intensity / of a sound source with power P measured a distance r away is: 1 = P/(4 x 1 ). (1) We also learned about the decibel system, which translates intensity measurements in W/m' to a logarithmic scale (measured in units of dB or decibels). The intensity 8 in decibels is related to the intensity in W/m' via B =10 log(1/lo), where lo = 10-1= W/m. (2) The sound intensity is related to the maximum displacement of the air molecules Smax, the angular frequency of the sound , the air density p, and the sound speed v via I = 12 pv w' Smax' . 1. Measuring decibel levels: a) First, make sure you understand the distinction between the amplitude of a sound wave and its intensity. Then make sure you understand how intensity is measured in both conventional SI units and in the logarithmic decibel scale. Refer to the appropriate sections of your textbook. b) The purpose of the first part of this lab is to gain intuition as to what volumes different decibel levels correspond to. You should download an appropriate decibel-meter app onto your phone (see Equipment section above)
Step by Step Solution
There are 3 Steps involved in it

Get step-by-step solutions from verified subject matter experts