Answered step by step
Verified Expert Solution
Question
1 Approved Answer
CA2_1.mat FIR Filter Code: function [ y ] = my_fir (x,h) %Declaration of the function for FIR h = h( : ) ; % No


CA2_1.mat

FIR Filter Code:
function [ y ] = my_fir (x,h) %Declaration of the function for FIR
h = h( : ) ; % No of Samples
L = length ( h ); %Calculating Length
L1 = L - 1; %Since it starts from 1 instead of 0, we subtract
x = [x (:) ; zeros(L1 , 1)] ; %Declaring Zeros
y = zeros (size(x)); %Checking Size
x = zeros (L , 1); %Specify Bandstop filter with stop band
for i = 1 : length(x) %FIR1 requires filter order (N) to be EVEN
X = [ x(i) ; X (1:L1) ];
y(i) = h*x ;
end
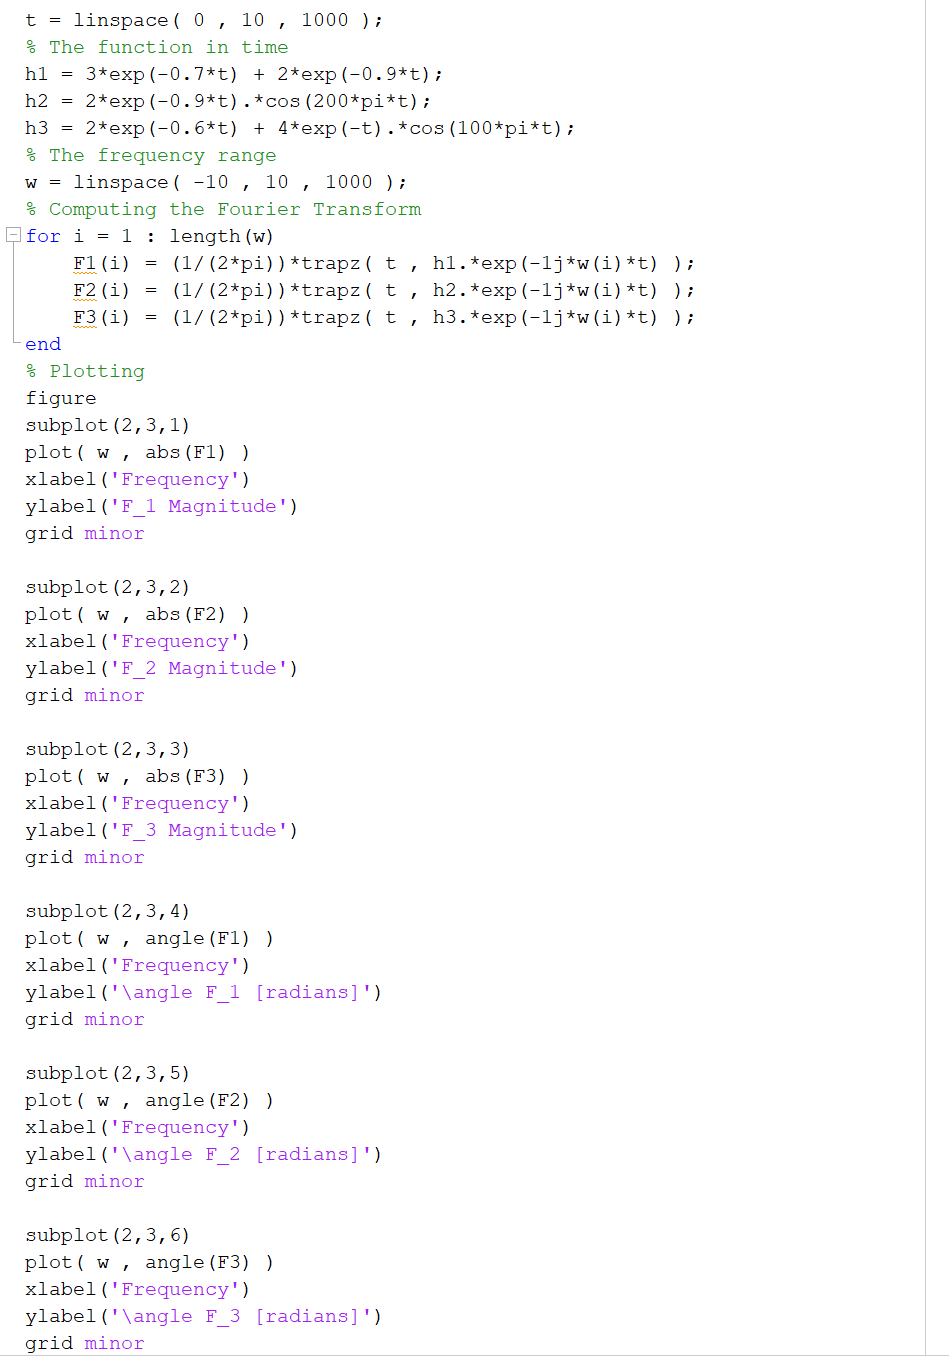
3. Canvas also contains a file called CA2_1.mat that contains the unit impulse response signal of a finite impulse response, discrete-time, linear, time-invariant system. Assume that the system is causal and that the unit impulse response signal starts at n = 0. The task here is to find the magnitude response of the filter for normalized frequencies in the range (in Matlab notation) **[-1:0.01:1]. To do this, perform the following tasks: (e) What type of a frequency-selective filter did the impulse response function provided in Canvas represent? t = linspace ( 0 , 10 , 1000); % The function in time hl = 3*exp(-0.7*t) + 2*exp(-0.9*t); h2 2*exp(-0.9*t).*cos (200*pi*t); h3 = 2*exp(-0.6*t) + 4*exp(-t).*cos (100*pi*t); % The frequency range w = linspace( -10 , 10 , 1000); % Computing the Fourier Transform for i = 1 : length (w) F1 (i) = (1/(2*pi))*trapz ( t, hl.*exp(-1j*w(i)*t) ); F2 (i) (1/(2*pi))*trapz( t, h2.*exp(-1j+w(i)*t) ); F3 (i) (1/(2*pi))*trapz ( t , h3.*exp(-1j*w(i)*t)); end % Plotting figure subplot (2,3,1) plot ( w, abs (F1) ) xlabel('Frequency') ylabel ('F_1 Magnitude') grid minor subplot (2,3,2) plot(w , abs (F2) ) xlabel('Frequency') ylabel('F_2 Magnitude') grid minor subplot (2,3,3) plot(w , abs (F3) ) xlabel('Frequency') ylabel ('F_3 Magnitude') grid minor subplot (2,3,4) plot(w, angle (F1) ) xlabel ('Frequency') ylabel('\angle F_1 [radians]') grid minor subplot (2,3,5) plot ( w, angle (F2)) xlabel ('Frequency') ylabel('\angle F_2 [radians]') grid minor subplot (2,3,6) plot( w, angle (F3) ) xlabel ('Frequency') ylabel('\angle F_3 [radians]') grid minor 3. Canvas also contains a file called CA2_1.mat that contains the unit impulse response signal of a finite impulse response, discrete-time, linear, time-invariant system. Assume that the system is causal and that the unit impulse response signal starts at n = 0. The task here is to find the magnitude response of the filter for normalized frequencies in the range (in Matlab notation) **[-1:0.01:1]. To do this, perform the following tasks: (e) What type of a frequency-selective filter did the impulse response function provided in Canvas represent? t = linspace ( 0 , 10 , 1000); % The function in time hl = 3*exp(-0.7*t) + 2*exp(-0.9*t); h2 2*exp(-0.9*t).*cos (200*pi*t); h3 = 2*exp(-0.6*t) + 4*exp(-t).*cos (100*pi*t); % The frequency range w = linspace( -10 , 10 , 1000); % Computing the Fourier Transform for i = 1 : length (w) F1 (i) = (1/(2*pi))*trapz ( t, hl.*exp(-1j*w(i)*t) ); F2 (i) (1/(2*pi))*trapz( t, h2.*exp(-1j+w(i)*t) ); F3 (i) (1/(2*pi))*trapz ( t , h3.*exp(-1j*w(i)*t)); end % Plotting figure subplot (2,3,1) plot ( w, abs (F1) ) xlabel('Frequency') ylabel ('F_1 Magnitude') grid minor subplot (2,3,2) plot(w , abs (F2) ) xlabel('Frequency') ylabel('F_2 Magnitude') grid minor subplot (2,3,3) plot(w , abs (F3) ) xlabel('Frequency') ylabel ('F_3 Magnitude') grid minor subplot (2,3,4) plot(w, angle (F1) ) xlabel ('Frequency') ylabel('\angle F_1 [radians]') grid minor subplot (2,3,5) plot ( w, angle (F2)) xlabel ('Frequency') ylabel('\angle F_2 [radians]') grid minor subplot (2,3,6) plot( w, angle (F3) ) xlabel ('Frequency') ylabel('\angle F_3 [radians]') grid minorStep by Step Solution
There are 3 Steps involved in it
Step: 1

Get Instant Access to Expert-Tailored Solutions
See step-by-step solutions with expert insights and AI powered tools for academic success
Step: 2

Step: 3

Ace Your Homework with AI
Get the answers you need in no time with our AI-driven, step-by-step assistance
Get Started


