Calculate:
1. the Viability ratio (Expendable Net Assets/Longterm Debt) 2. Primary Reserve Ratio (Expendable Net Assets/Total Expenses) 3. Net Assets Ratio (Change in Net Assets/Total Net Assets) 4. Net Operating Revenue Ratio (Operating Income/Revenue)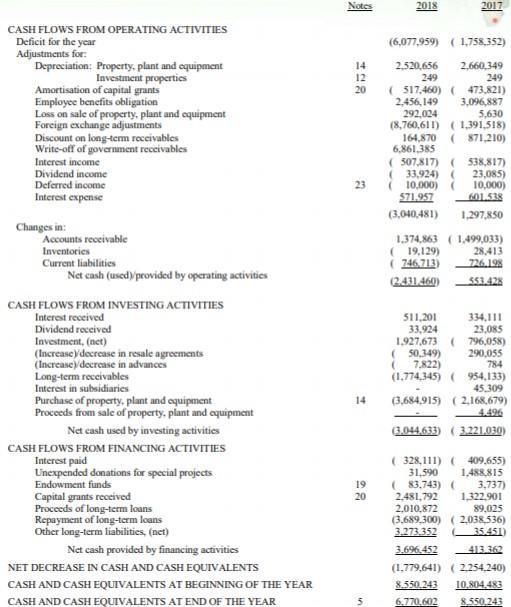
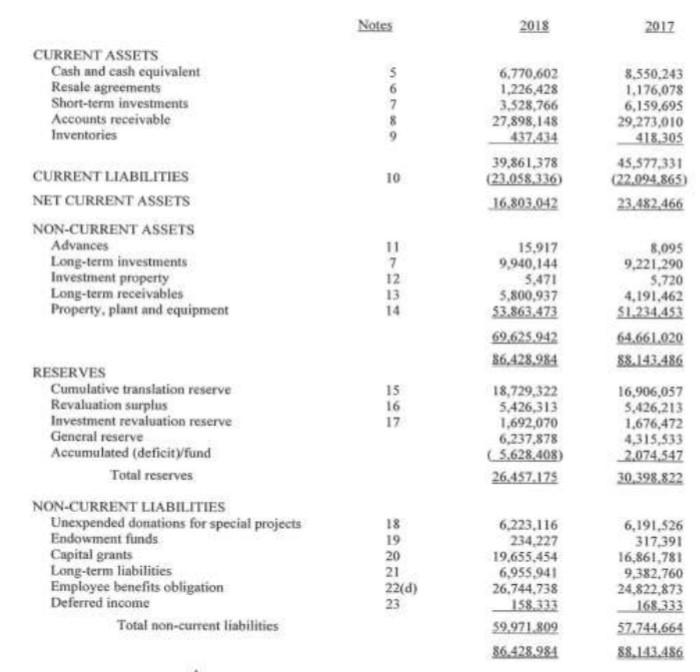
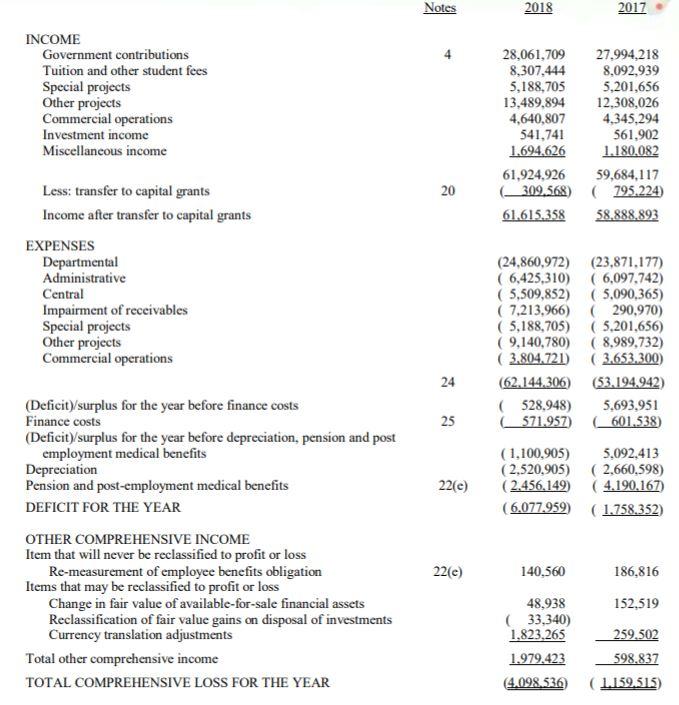
Notes 2018 2017 (6,077.959) (1.758,352) 14 12 20 CASH FLOWS FROM OPERATING ACTIVITIES Deficit for the year Adjustments for: Depreciation Property, plant and equipment Investment properties Amortisation of capital grants Employee benefits obligation Loss on sale of property, plant and equipment Foreign exchange adjustments Discount on long-term receivables Write-off of government receivables Interest income Dividend income Deferred income Interest expense 2.520.656 2.660.349 249 249 (517,460) (473.821) 2.456,149 3.096,887 292.024 5,630 (8,760,611) (1.391,518) 164,870 (871,210) 6.861,385 (507,817) (538,817) (33.924) 23.085) 10,000) 10,000) $71.957 601.538 (3,040,481) 1.297,850 Changes in: Accounts receivable Inventories Current liabilities Net cash (usedprovided by operating activities 1.374,863 (1.499,033) 19,129) 28.413 746 713) 726.198 (2.431.460) 553.428 511,201 334,111 33,924 23,085 1.927,673 (796,058) (50.349) 290,055 7.822) 784 (1.774.345) (954,133) 45.309 (3,684,915) (2,168,679) 4.496 0.044,633) (3.221.030) 14 CASH FLOWS FROM INVESTING ACTIVITIES Interest received Dividend received Investment, (net) (Increase y decrease in resale agreements (Increasey decrease in advances Long-term receivables Interest in subsidiaries Purchase of property, plant and equipment Proceeds from sale of property, plant and equipment Net cash used by investing activities CASH FLOWS FROM FINANCING ACTIVITIES Interest paid Unexpended donations for special projects Endowment funds Capital grants received Proceeds of long-term loans Repayment of long-term loans Other long-term liabilities, (net) Net cash provided by financing activities NET DECREASE IN CASH AND CASH EQUIVALENTS CASH AND CASH EQUIVALENTS AT BEGINNING OF THE YEAR CASH AND CASH EQUIVALENTS AT END OF THE YEAR 19 20 (328,111) (409.655) 31,590 1.488.815 (83.743) 3.737) 2.481,792 1.322.901 2.010.872 89,025 (3.689.300) (2,038,536) 3.273.352 35.451) 3.696452 413.362 (1.779,641) (2.254.240) 8.550 243 10.804.483 6.770.602 8.550.243 Notes 2018 2017 CURRENT ASSETS Cash and cash equivalent Resale agreements Short-term investments Accounts receivable Inventories MONO 7 6,770,602 1,226,428 3,528,766 27,898,148 437.434 39.861,378 (23.058,336) 16.803,042 8.530.243 1.176,078 6,159,695 29,273,010 418,305 45,577,331 (22.094.865) 23,482,466 10 CURRENT LIABILITIES NET CURRENT ASSETS NON-CURRENT ASSETS Advances Long-term investments Investment property Long-term receivables Property, plant and equipment 11 7 12 13 14 15,917 9,940,144 5,471 5,800,937 53.863,473 69.625,942 86,428.984 18,729,322 5,426,313 1,692,070 6,237,878 (5.628,408) 26.457.175 8,095 9,221,290 5.720 4,191,462 51.234,453 64.661.020 88.143.486 16,906,057 5.426,213 1.676,472 4,315,533 2.074.547 30.398.822 15 16 17 RESERVES Cumulative translation reserve Revaluation surplus Investment revaluation reserve General reserve Accumulated (deficit fund Total reserves NON-CURRENT LIABILITIES Unexpended donations for special projects Endowment funds Capital grants Long-term liabilities Employee benefits obligation Deferred income Total non-current liabilities 18 19 20 21 22(d) 6,223.116 234.227 19.655.454 6,955941 26,744,738 158,333 59.971.809 86.428.984 6,191,526 317,391 16,861.781 9,382.760 24,822,873 168.333 57.744,664 88.143.486 23 Notes 2018 2017 INCOME Government contributions Tuition and other student fees Special projects Other projects Commercial operations Investment income Miscellaneous income 28,061,709 27.994,218 8,307.444 8.092,939 5,188,705 5,201,656 13,489,894 12,308,026 4,640,807 4,345,294 541,741 561,902 1.694.626 1.180,082 61.924.926 59,684,117 309.568) (795.224) 61.615.358 58.888.893 20 Less: transfer to capital grants Income after transfer to capital grants EXPENSES Departmental Administrative Central Impairment of receivables Special projects Other projects Commercial operations 24 (24.860,972) (23.871.177) (6,425,310) (6,097.742) ( 5,509,852) (5.090,365) ( 7.213.966) (290,970) ( 5,188,705) (5,201,656) (9,140,780) (8,989,732) (3.804.721) (3.653.300) (62.144.306) (53.194.942) (528,948) 5,693,951 571,957) (601,538) (1,100,905) 5.092,413 (2,520,905) (2,660,598) (2.456,149) (4.190,167) (6.077.959) (1.758.352) 25 22(e) (Deficit/surplus for the year before finance costs Finance costs (Deficit)/surplus for the year before depreciation, pension and post employment medical benefits Depreciation Pension and post-employment medical benefits DEFICIT FOR THE YEAR OTHER COMPREHENSIVE INCOME Item that will never be reclassified to profit or loss Re-measurement of employee benefits obligation Items that may be reclassified to profit or loss Change in fair value of available-for-sale financial assets Reclassification of fair value gains on disposal of investments Currency translation adjustments Total other comprehensive income TOTAL COMPREHENSIVE LOSS FOR THE YEAR 22(e) 140,560 186,816 152,519 48,938 33,340) 1.823,265 1.979.423 (4.098,536 259.502 598,837 (1.159.515) Notes 2018 2017 (6,077.959) (1.758,352) 14 12 20 CASH FLOWS FROM OPERATING ACTIVITIES Deficit for the year Adjustments for: Depreciation Property, plant and equipment Investment properties Amortisation of capital grants Employee benefits obligation Loss on sale of property, plant and equipment Foreign exchange adjustments Discount on long-term receivables Write-off of government receivables Interest income Dividend income Deferred income Interest expense 2.520.656 2.660.349 249 249 (517,460) (473.821) 2.456,149 3.096,887 292.024 5,630 (8,760,611) (1.391,518) 164,870 (871,210) 6.861,385 (507,817) (538,817) (33.924) 23.085) 10,000) 10,000) $71.957 601.538 (3,040,481) 1.297,850 Changes in: Accounts receivable Inventories Current liabilities Net cash (usedprovided by operating activities 1.374,863 (1.499,033) 19,129) 28.413 746 713) 726.198 (2.431.460) 553.428 511,201 334,111 33,924 23,085 1.927,673 (796,058) (50.349) 290,055 7.822) 784 (1.774.345) (954,133) 45.309 (3,684,915) (2,168,679) 4.496 0.044,633) (3.221.030) 14 CASH FLOWS FROM INVESTING ACTIVITIES Interest received Dividend received Investment, (net) (Increase y decrease in resale agreements (Increasey decrease in advances Long-term receivables Interest in subsidiaries Purchase of property, plant and equipment Proceeds from sale of property, plant and equipment Net cash used by investing activities CASH FLOWS FROM FINANCING ACTIVITIES Interest paid Unexpended donations for special projects Endowment funds Capital grants received Proceeds of long-term loans Repayment of long-term loans Other long-term liabilities, (net) Net cash provided by financing activities NET DECREASE IN CASH AND CASH EQUIVALENTS CASH AND CASH EQUIVALENTS AT BEGINNING OF THE YEAR CASH AND CASH EQUIVALENTS AT END OF THE YEAR 19 20 (328,111) (409.655) 31,590 1.488.815 (83.743) 3.737) 2.481,792 1.322.901 2.010.872 89,025 (3.689.300) (2,038,536) 3.273.352 35.451) 3.696452 413.362 (1.779,641) (2.254.240) 8.550 243 10.804.483 6.770.602 8.550.243 Notes 2018 2017 CURRENT ASSETS Cash and cash equivalent Resale agreements Short-term investments Accounts receivable Inventories MONO 7 6,770,602 1,226,428 3,528,766 27,898,148 437.434 39.861,378 (23.058,336) 16.803,042 8.530.243 1.176,078 6,159,695 29,273,010 418,305 45,577,331 (22.094.865) 23,482,466 10 CURRENT LIABILITIES NET CURRENT ASSETS NON-CURRENT ASSETS Advances Long-term investments Investment property Long-term receivables Property, plant and equipment 11 7 12 13 14 15,917 9,940,144 5,471 5,800,937 53.863,473 69.625,942 86,428.984 18,729,322 5,426,313 1,692,070 6,237,878 (5.628,408) 26.457.175 8,095 9,221,290 5.720 4,191,462 51.234,453 64.661.020 88.143.486 16,906,057 5.426,213 1.676,472 4,315,533 2.074.547 30.398.822 15 16 17 RESERVES Cumulative translation reserve Revaluation surplus Investment revaluation reserve General reserve Accumulated (deficit fund Total reserves NON-CURRENT LIABILITIES Unexpended donations for special projects Endowment funds Capital grants Long-term liabilities Employee benefits obligation Deferred income Total non-current liabilities 18 19 20 21 22(d) 6,223.116 234.227 19.655.454 6,955941 26,744,738 158,333 59.971.809 86.428.984 6,191,526 317,391 16,861.781 9,382.760 24,822,873 168.333 57.744,664 88.143.486 23 Notes 2018 2017 INCOME Government contributions Tuition and other student fees Special projects Other projects Commercial operations Investment income Miscellaneous income 28,061,709 27.994,218 8,307.444 8.092,939 5,188,705 5,201,656 13,489,894 12,308,026 4,640,807 4,345,294 541,741 561,902 1.694.626 1.180,082 61.924.926 59,684,117 309.568) (795.224) 61.615.358 58.888.893 20 Less: transfer to capital grants Income after transfer to capital grants EXPENSES Departmental Administrative Central Impairment of receivables Special projects Other projects Commercial operations 24 (24.860,972) (23.871.177) (6,425,310) (6,097.742) ( 5,509,852) (5.090,365) ( 7.213.966) (290,970) ( 5,188,705) (5,201,656) (9,140,780) (8,989,732) (3.804.721) (3.653.300) (62.144.306) (53.194.942) (528,948) 5,693,951 571,957) (601,538) (1,100,905) 5.092,413 (2,520,905) (2,660,598) (2.456,149) (4.190,167) (6.077.959) (1.758.352) 25 22(e) (Deficit/surplus for the year before finance costs Finance costs (Deficit)/surplus for the year before depreciation, pension and post employment medical benefits Depreciation Pension and post-employment medical benefits DEFICIT FOR THE YEAR OTHER COMPREHENSIVE INCOME Item that will never be reclassified to profit or loss Re-measurement of employee benefits obligation Items that may be reclassified to profit or loss Change in fair value of available-for-sale financial assets Reclassification of fair value gains on disposal of investments Currency translation adjustments Total other comprehensive income TOTAL COMPREHENSIVE LOSS FOR THE YEAR 22(e) 140,560 186,816 152,519 48,938 33,340) 1.823,265 1.979.423 (4.098,536 259.502 598,837 (1.159.515)