Calculate all ratios from column H to N all the way down to quick ratio.
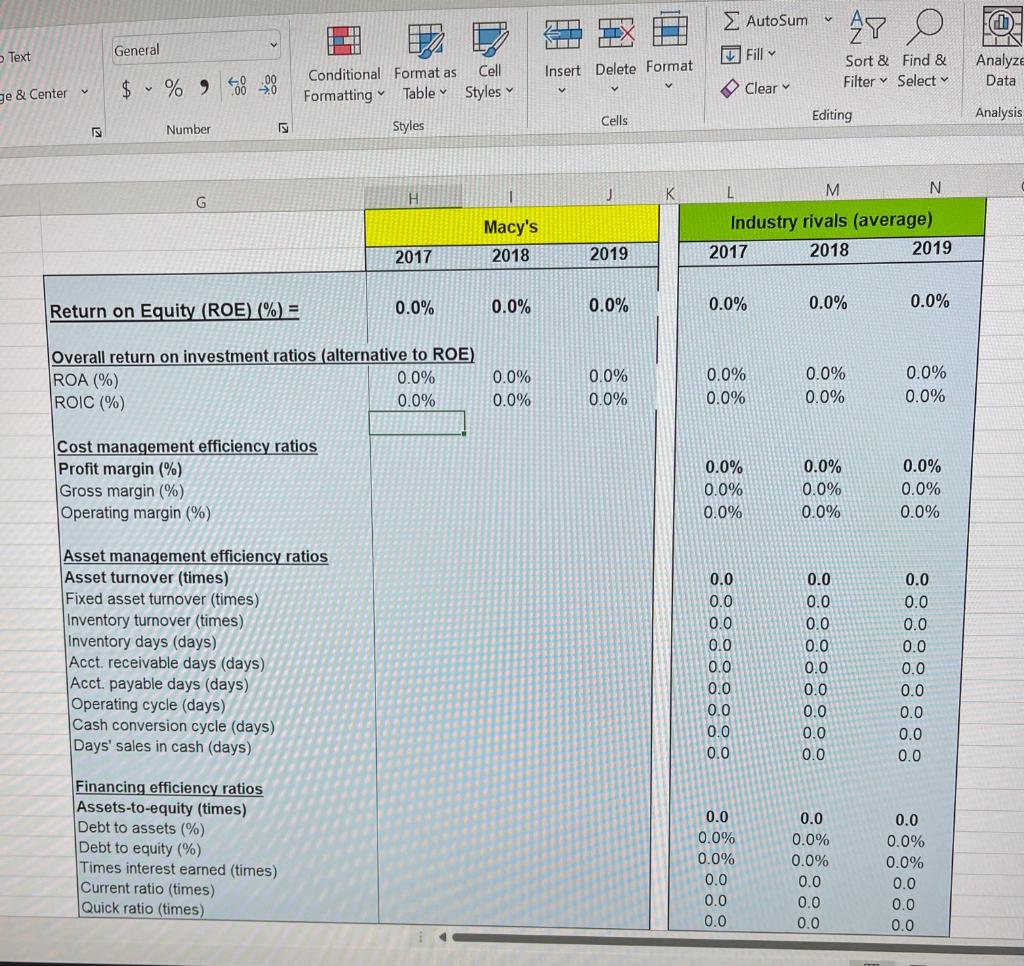
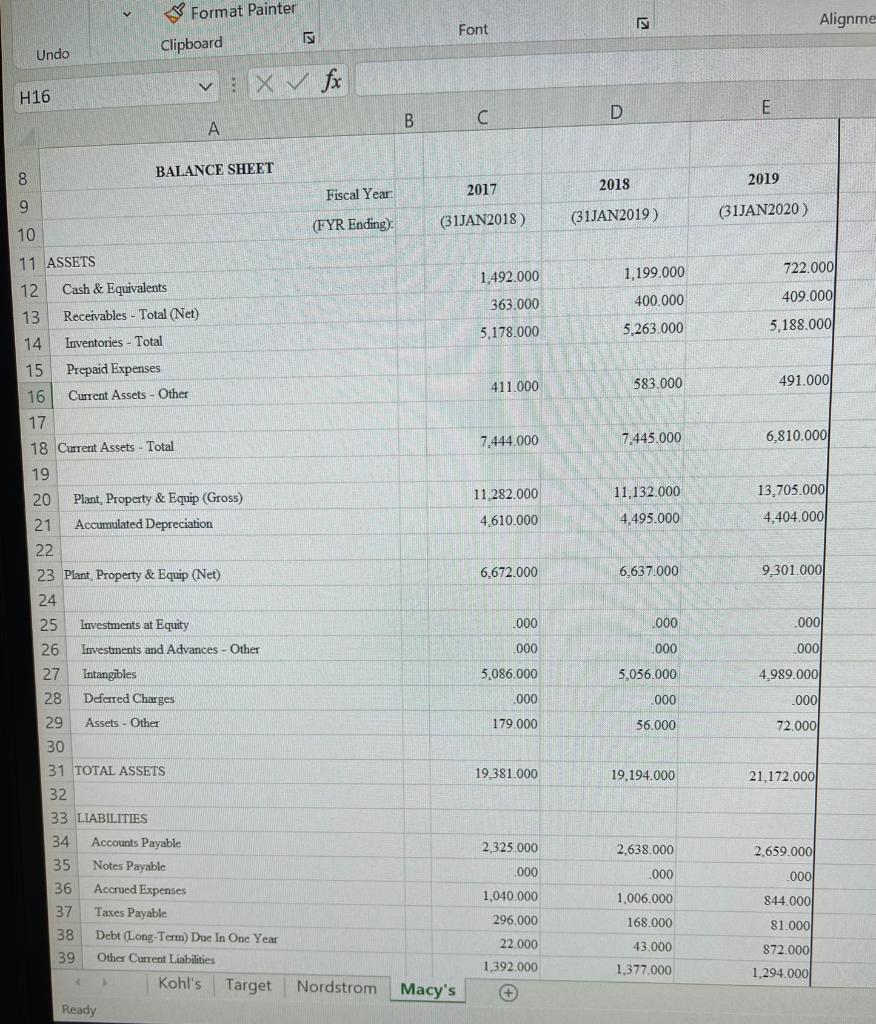
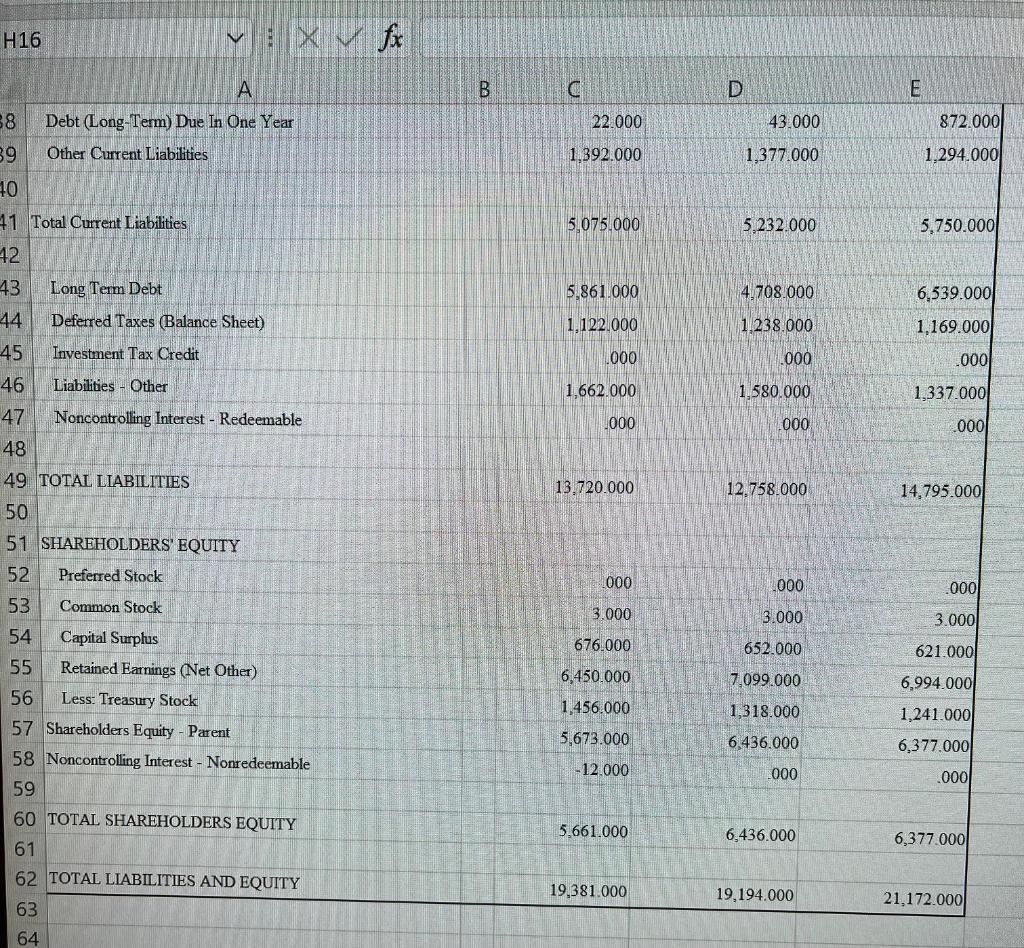
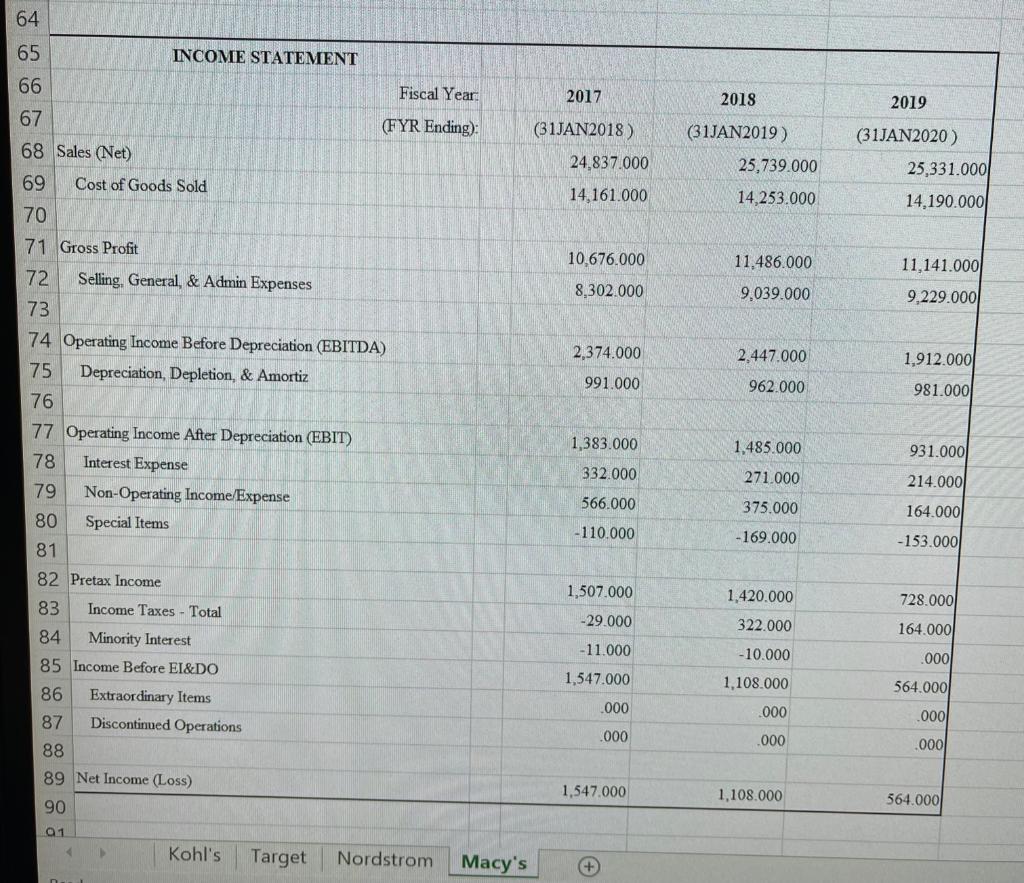
AutoSum 27 0 FO I Text General Fill Insert Delete Format Sort & Find & Filter Select Analyze Data v ge & Center $ % Clear Conditional Format as Cell Formatting Table Styles Styles Cells Editing Analysis Number N J M K H G Macy's 2018 Industry rivals (average) 2017 2018 2019 2017 2019 0.0% 0.0% Return on Equity (ROE) (%) = 0.0% 0.0% 0.0% 0.0% Overall return on investment ratios (alternative to ROE) ROA (%) 0.0% ROIC (%) 0.0% 0.0% 0.0% 0.0% 0.0% 0.0% 0.0% 0.0% 0.0% 0.0% 0.0% Cost management efficiency ratios Profit margin (%) Gross margin (%) Operating margin (%) 0.0% 0.0% 0.0% 0.0% 0.0% 0.0% 0.0% 0.0% 0.0% Asset management efficiency ratios Asset turnover (times) Fixed asset turnover (times) Inventory turnover (times) Inventory days (days) Acct. receivable days (days) Acct. payable days (days) Operating cycle (days) Cash conversion cycle (days) Days' sales in cash (days) 0.0 0.0 0.0 0.0 0.0 0.0 0.0 0.0 0.0 0.0 0.0 0.0 0.0 0.0 0.0 0.0 0.0 0.0 0.0 0.0 0.0 0.0 0.0 0.0 0.0 0.0 0.0 OOOOOOOOO ooooooooo Financing efficiency ratios Assets-to-equity (times) Debt to assets (%) Debt to equity (%) Times interest earned (times) Current ratio (times) Quick ratio (times) 0.0 0.0% 0.0% 0.0 0.0 0.0 0.0 0.0% 0.0% 0.0 0.0 0.0 0.0 0.0% 0.0% 0.0 0.0 0.0 2 Format Painter Clipboard Alignme Font Undo v: X V fx H16 E B D C A BALANCE SHEET 8 2018 2019 2017 Fiscal Year 9 (31JAN2020) (FYR Ending): (31JAN2018) (31JAN2019) 10 1,492.000 1,199.000 722.000 363.000 400.000 11 ASSETS 12 Cash & Equivalents 13 Receivables - Total (Net) 14 Inventories - Total 15 Prepaid Expenses 16 Current Assets - Other 409.000 5.188.000 5,178.000 5.263.000 411.000 583.000 491.000 7.444.000 7.445.000 6,810.000 11,282.000 11,132.000 4,495.000 13,705.000 4.404.000 4.610.000 17 18 Current Assets - Total 19 20 Plant, Property & Equip (Gross) 21 Accumulated Depreciation 22 23 Plant Property & Equip (Net) 24 25 Investments at Equity 26 Investments and Advances - Other 27 Intangibles 28 Deferred Charges 29 Assets - Other 6,672.000 6,637.000 9,301.000 2000 1000 2.000 L000 000 .000 5,086.000 5,056.000 4.989.000 000 .000 .000 179.000 56.000 72.000 30 19,381.000 31 TOTAL ASSETS 32 19.194.000 21.172.000 33 LIABILITIES 34 2.325.000 2.638.000 2.659.000 .000 .000 35 36 37 38 .000 1,040.000 844.000 Accounts Payable Notes Payable Accrued Expenses Taxes Payable Debt (Long-Term) Due In One Year Other Current Liabilities Kohl's Target 1.006.000 168.000 296.000 81.000 43.000 39 22.000 1,392.000 872.000 1,294.000 1.377.000 Nordstrom Macy's Ready H16 v : XV fx B C D E 22.000 43.000 872.000 38 39 Debt (Long-Term) Due In One Year Other Current Liabilities 1.392.000 1,377.000 1,294.000 10 41 Total Current Liabilities 5,075.000 5.232.000 5,750.000 42 5.861.000 4.708.000 6,539.000 43 44 45 Long Term Debt Deferred Taxes (Balance Sheet) Investment Tax Credit 1.122.000 1.238.000 1,169.000 .000 .000 2000 46 Liabilities - Other 1,662.000 1.580.000 1,337.000 .000 000 000 47 Noncontrolling Interest - Redeemable 48 49 TOTAL LIABILITIES 13.720.000 12,758.000 14,795.000 1000 2000 .000 3.000 3.000 3.000 50 51 SHAREHOLDERS' EQUITY 52 Preferred Stock 53 Common Stock 54 Capital Surplus 55 Retained Earnings (Net Other) 56 Less: Treasury Stock 57 Shareholders Equity - Parent 58 Noncontrolling Interest - Nonredeemable 59 652.000 621.000 676.000 6,450.000 1.456.000 7.099.000 6,994.000 1,318.000 1,241.000 5,673.000 6.436.000 6,377.000 -12.000 000 .000 5.661.000 6,436.000 60 TOTAL SHAREHOLDERS EQUITY 61 62 TOTAL LIABILITIES AND EQUITY 6,377.000 19.381.000 19,194.000 21,172.000 63 64 64 65 INCOME STATEMENT 66 Fiscal Year 2017 2018 2019 67 68 Sales (Net) (FYR Ending): (31JAN2018) 24,837.000 (31JAN2019) 25,739.000 14,253,000 (31JAN2020) 25,331.000 14.190.000 69 Cost of Goods Sold 14,161.000 70 71 Gross Profit 10.676.000 11,141.000 11.486.000 9.039.000 8,302.000 9.229.000 2,374.000 2.447.000 1,912.000 991.000 962.000 981.0001 72 Selling. General, & Admin Expenses 73 74 Operating Income Before Depreciation (EBITDA) 75 Depreciation, Depletion, & Amortiz 76 77 Operating Income After Depreciation (EBIT) 78 Interest Expense 79 Non-Operating Income/Expense 80 Special Items 81 1,383.000 931.000 1,485.000 271.000 332.000 214.000 566.000 375.000 164.000 -110.000 - 169.000 -153.000 82 Pretax Income 1,507.000 1,420.000 728.0001 83 Income Taxes - Total -29.000 322.000 164.000 -11.000 - 10.000 .000 84 Minority Interest 85 Income Before EI&DO 86 Extraordinary Items 1,547.000 1,108.000 564.000 .000 .000 87 .000 Discontinued Operations .000 .000 88 .000 89 Net Income (Loss) 1,547.000 1.108.000 90 564.0001 01 Kohl's Target Nordstrom Macy's AutoSum 27 0 FO I Text General Fill Insert Delete Format Sort & Find & Filter Select Analyze Data v ge & Center $ % Clear Conditional Format as Cell Formatting Table Styles Styles Cells Editing Analysis Number N J M K H G Macy's 2018 Industry rivals (average) 2017 2018 2019 2017 2019 0.0% 0.0% Return on Equity (ROE) (%) = 0.0% 0.0% 0.0% 0.0% Overall return on investment ratios (alternative to ROE) ROA (%) 0.0% ROIC (%) 0.0% 0.0% 0.0% 0.0% 0.0% 0.0% 0.0% 0.0% 0.0% 0.0% 0.0% Cost management efficiency ratios Profit margin (%) Gross margin (%) Operating margin (%) 0.0% 0.0% 0.0% 0.0% 0.0% 0.0% 0.0% 0.0% 0.0% Asset management efficiency ratios Asset turnover (times) Fixed asset turnover (times) Inventory turnover (times) Inventory days (days) Acct. receivable days (days) Acct. payable days (days) Operating cycle (days) Cash conversion cycle (days) Days' sales in cash (days) 0.0 0.0 0.0 0.0 0.0 0.0 0.0 0.0 0.0 0.0 0.0 0.0 0.0 0.0 0.0 0.0 0.0 0.0 0.0 0.0 0.0 0.0 0.0 0.0 0.0 0.0 0.0 OOOOOOOOO ooooooooo Financing efficiency ratios Assets-to-equity (times) Debt to assets (%) Debt to equity (%) Times interest earned (times) Current ratio (times) Quick ratio (times) 0.0 0.0% 0.0% 0.0 0.0 0.0 0.0 0.0% 0.0% 0.0 0.0 0.0 0.0 0.0% 0.0% 0.0 0.0 0.0 2 Format Painter Clipboard Alignme Font Undo v: X V fx H16 E B D C A BALANCE SHEET 8 2018 2019 2017 Fiscal Year 9 (31JAN2020) (FYR Ending): (31JAN2018) (31JAN2019) 10 1,492.000 1,199.000 722.000 363.000 400.000 11 ASSETS 12 Cash & Equivalents 13 Receivables - Total (Net) 14 Inventories - Total 15 Prepaid Expenses 16 Current Assets - Other 409.000 5.188.000 5,178.000 5.263.000 411.000 583.000 491.000 7.444.000 7.445.000 6,810.000 11,282.000 11,132.000 4,495.000 13,705.000 4.404.000 4.610.000 17 18 Current Assets - Total 19 20 Plant, Property & Equip (Gross) 21 Accumulated Depreciation 22 23 Plant Property & Equip (Net) 24 25 Investments at Equity 26 Investments and Advances - Other 27 Intangibles 28 Deferred Charges 29 Assets - Other 6,672.000 6,637.000 9,301.000 2000 1000 2.000 L000 000 .000 5,086.000 5,056.000 4.989.000 000 .000 .000 179.000 56.000 72.000 30 19,381.000 31 TOTAL ASSETS 32 19.194.000 21.172.000 33 LIABILITIES 34 2.325.000 2.638.000 2.659.000 .000 .000 35 36 37 38 .000 1,040.000 844.000 Accounts Payable Notes Payable Accrued Expenses Taxes Payable Debt (Long-Term) Due In One Year Other Current Liabilities Kohl's Target 1.006.000 168.000 296.000 81.000 43.000 39 22.000 1,392.000 872.000 1,294.000 1.377.000 Nordstrom Macy's Ready H16 v : XV fx B C D E 22.000 43.000 872.000 38 39 Debt (Long-Term) Due In One Year Other Current Liabilities 1.392.000 1,377.000 1,294.000 10 41 Total Current Liabilities 5,075.000 5.232.000 5,750.000 42 5.861.000 4.708.000 6,539.000 43 44 45 Long Term Debt Deferred Taxes (Balance Sheet) Investment Tax Credit 1.122.000 1.238.000 1,169.000 .000 .000 2000 46 Liabilities - Other 1,662.000 1.580.000 1,337.000 .000 000 000 47 Noncontrolling Interest - Redeemable 48 49 TOTAL LIABILITIES 13.720.000 12,758.000 14,795.000 1000 2000 .000 3.000 3.000 3.000 50 51 SHAREHOLDERS' EQUITY 52 Preferred Stock 53 Common Stock 54 Capital Surplus 55 Retained Earnings (Net Other) 56 Less: Treasury Stock 57 Shareholders Equity - Parent 58 Noncontrolling Interest - Nonredeemable 59 652.000 621.000 676.000 6,450.000 1.456.000 7.099.000 6,994.000 1,318.000 1,241.000 5,673.000 6.436.000 6,377.000 -12.000 000 .000 5.661.000 6,436.000 60 TOTAL SHAREHOLDERS EQUITY 61 62 TOTAL LIABILITIES AND EQUITY 6,377.000 19.381.000 19,194.000 21,172.000 63 64 64 65 INCOME STATEMENT 66 Fiscal Year 2017 2018 2019 67 68 Sales (Net) (FYR Ending): (31JAN2018) 24,837.000 (31JAN2019) 25,739.000 14,253,000 (31JAN2020) 25,331.000 14.190.000 69 Cost of Goods Sold 14,161.000 70 71 Gross Profit 10.676.000 11,141.000 11.486.000 9.039.000 8,302.000 9.229.000 2,374.000 2.447.000 1,912.000 991.000 962.000 981.0001 72 Selling. General, & Admin Expenses 73 74 Operating Income Before Depreciation (EBITDA) 75 Depreciation, Depletion, & Amortiz 76 77 Operating Income After Depreciation (EBIT) 78 Interest Expense 79 Non-Operating Income/Expense 80 Special Items 81 1,383.000 931.000 1,485.000 271.000 332.000 214.000 566.000 375.000 164.000 -110.000 - 169.000 -153.000 82 Pretax Income 1,507.000 1,420.000 728.0001 83 Income Taxes - Total -29.000 322.000 164.000 -11.000 - 10.000 .000 84 Minority Interest 85 Income Before EI&DO 86 Extraordinary Items 1,547.000 1,108.000 564.000 .000 .000 87 .000 Discontinued Operations .000 .000 88 .000 89 Net Income (Loss) 1,547.000 1.108.000 90 564.0001 01 Kohl's Target Nordstrom Macy's