Calculate and analyze:
Dividend Yield
Operating Profit Margin
Return on Capital Employed (ROCE)
Return on shareholders equity (ROSE)
Price/Earnings
Earnings per share
Current Ratio
Gearing Ratio
Debt/Equity
Dividend per Share
Interest Cover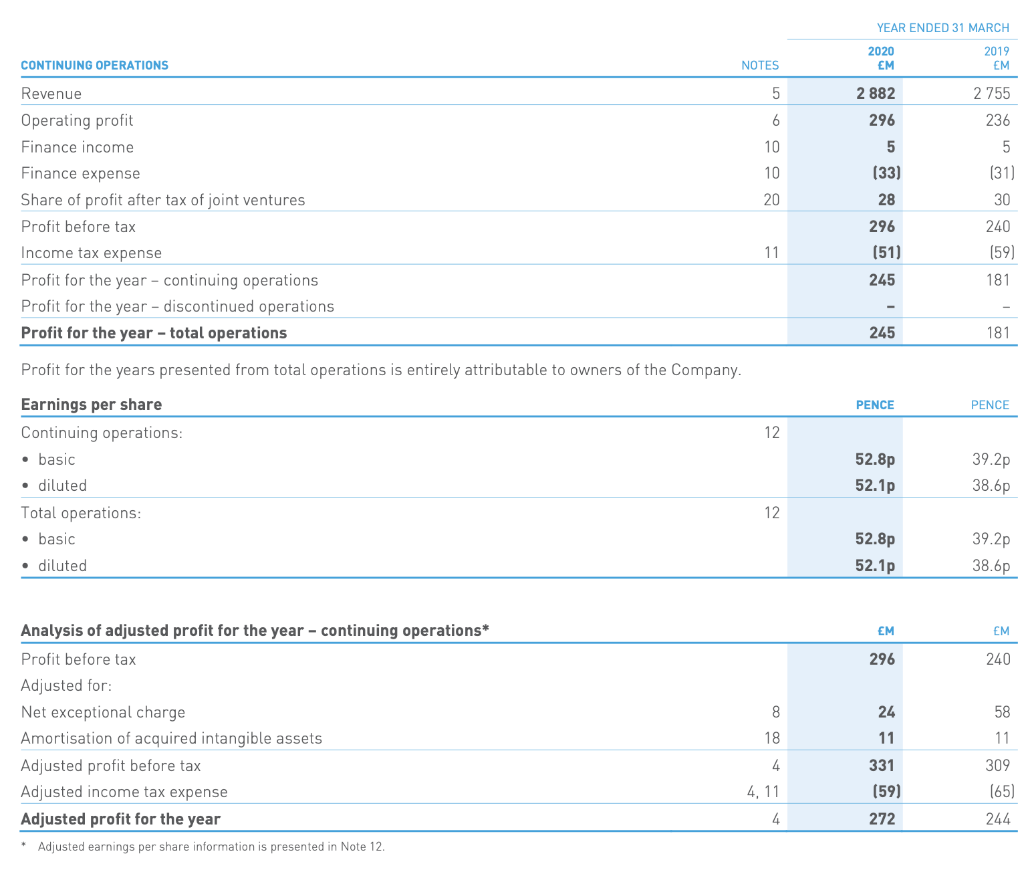
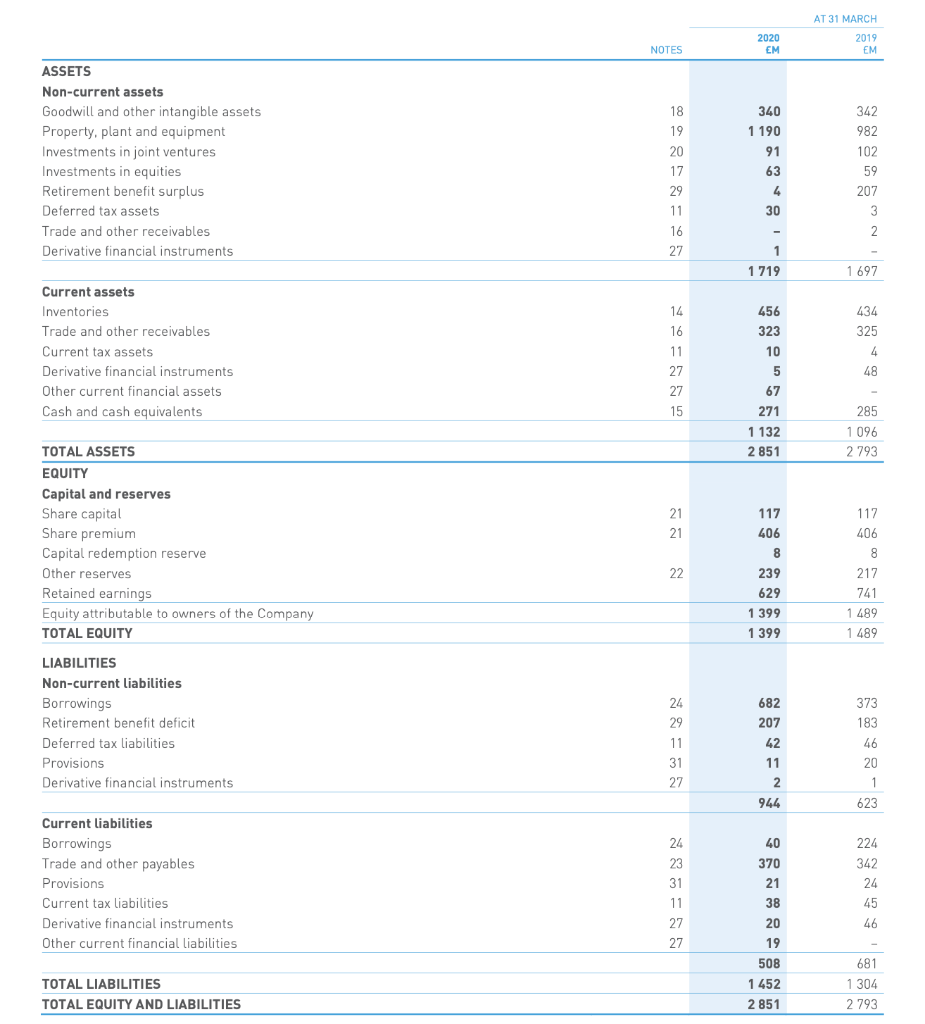
YEAR ENDED 31 MARCH 2020 2019 EM EM CONTINUING OPERATIONS NOTES 5 2 882 296 6 10 2755 236 5 (31) 5 (33) 10 20 28 30 Revenue Operating profit Finance income Finance expense Share of profit after tax of joint ventures Profit before tax Income tax expense Profit for the year - continuing operations Profit for the year - discontinued operations Profit for the year - total operations 296 (51) 11 240 (59) 181 245 245 181 Profit for the years presented from total operations is entirely attributable to owners of the Company. PENCE PENCE 12 Earnings per share Continuing operations: basic diluted Total operations: basic diluted 52.8p 52.1p 39.2p 38.6p 12 52.8p 39.2p 38.6p 52.1p EM EM 296 240 8 24 58 Analysis of adjusted profit for the year - continuing operations* Profit before tax Adjusted for: Net exceptional charge Amortisation of acquired intangible assets Adjusted profit before tax Adjusted income tax expense Adjusted profit for the year Adjusted earnings per share information is presented in Note 12. 18 11 4 11 309 (65) 244 331 (59) 272 4, 11 4 AT 31 MARCH 2020 EM 2019 EM NOTES ASSETS Non-current assets Goodwill and other intangible assets Property, plant and equipment Investments in joint ventures Investments in equities Retirement benefit surplus Deferred tax assets Trade and other receivables Derivative financial instruments 18 19 20 17 29 11 16 27 340 1 190 91 63 4 30 342 982 102 59 207 3 2 1 1 719 - 1 697 Current assets Inventories Trade and other receivables Current tax assets Derivative financial instruments Other current financial assets Cash and cash equivalents 434 325 4 14 16 11 27 27 15 48 456 323 10 5 67 271 1 132 2 851 - 285 1 096 2793 21 21 117 406 TOTAL ASSETS EQUITY Capital and reserves Share capital Share premium Capital redemption reserve Other reserves Retained earnings Equity attributable to owners of the Company TOTAL EQUITY 22 117 406 8 239 629 1 399 1 399 8 217 741 1489 1489 LIABILITIES Non-current liabilities Borrowings Retirement benefit deficit Deferred tax liabilities Provisions Derivative financial instruments 24 29 11 31 27 373 183 46 682 207 42 11 2 944 20 1 623 Current liabilities Borrowings Trade and other payables Provisions Current tax liabilities Derivative financial instruments Other current financial liabilities 24 23 31 224 342 24 40 370 21 38 20 19 508 45 46 27 27 1 452 TOTAL LIABILITIES TOTAL EQUITY AND LIABILITIES 681 1 304 2 793 2 851 YEAR ENDED 31 MARCH 2020 2019 EM EM CONTINUING OPERATIONS NOTES 5 2 882 296 6 10 2755 236 5 (31) 5 (33) 10 20 28 30 Revenue Operating profit Finance income Finance expense Share of profit after tax of joint ventures Profit before tax Income tax expense Profit for the year - continuing operations Profit for the year - discontinued operations Profit for the year - total operations 296 (51) 11 240 (59) 181 245 245 181 Profit for the years presented from total operations is entirely attributable to owners of the Company. PENCE PENCE 12 Earnings per share Continuing operations: basic diluted Total operations: basic diluted 52.8p 52.1p 39.2p 38.6p 12 52.8p 39.2p 38.6p 52.1p EM EM 296 240 8 24 58 Analysis of adjusted profit for the year - continuing operations* Profit before tax Adjusted for: Net exceptional charge Amortisation of acquired intangible assets Adjusted profit before tax Adjusted income tax expense Adjusted profit for the year Adjusted earnings per share information is presented in Note 12. 18 11 4 11 309 (65) 244 331 (59) 272 4, 11 4 AT 31 MARCH 2020 EM 2019 EM NOTES ASSETS Non-current assets Goodwill and other intangible assets Property, plant and equipment Investments in joint ventures Investments in equities Retirement benefit surplus Deferred tax assets Trade and other receivables Derivative financial instruments 18 19 20 17 29 11 16 27 340 1 190 91 63 4 30 342 982 102 59 207 3 2 1 1 719 - 1 697 Current assets Inventories Trade and other receivables Current tax assets Derivative financial instruments Other current financial assets Cash and cash equivalents 434 325 4 14 16 11 27 27 15 48 456 323 10 5 67 271 1 132 2 851 - 285 1 096 2793 21 21 117 406 TOTAL ASSETS EQUITY Capital and reserves Share capital Share premium Capital redemption reserve Other reserves Retained earnings Equity attributable to owners of the Company TOTAL EQUITY 22 117 406 8 239 629 1 399 1 399 8 217 741 1489 1489 LIABILITIES Non-current liabilities Borrowings Retirement benefit deficit Deferred tax liabilities Provisions Derivative financial instruments 24 29 11 31 27 373 183 46 682 207 42 11 2 944 20 1 623 Current liabilities Borrowings Trade and other payables Provisions Current tax liabilities Derivative financial instruments Other current financial liabilities 24 23 31 224 342 24 40 370 21 38 20 19 508 45 46 27 27 1 452 TOTAL LIABILITIES TOTAL EQUITY AND LIABILITIES 681 1 304 2 793 2 851