Answered step by step
Verified Expert Solution
Question
1 Approved Answer
Calculate confidence interval estimates for the proportion State the confidence interval using the MoE. What does this confidence interval estimate? Use the Confidence Interval template
- Calculate confidence interval estimates for the proportion
- State the confidence interval using the MoE. What does this confidence interval estimate?
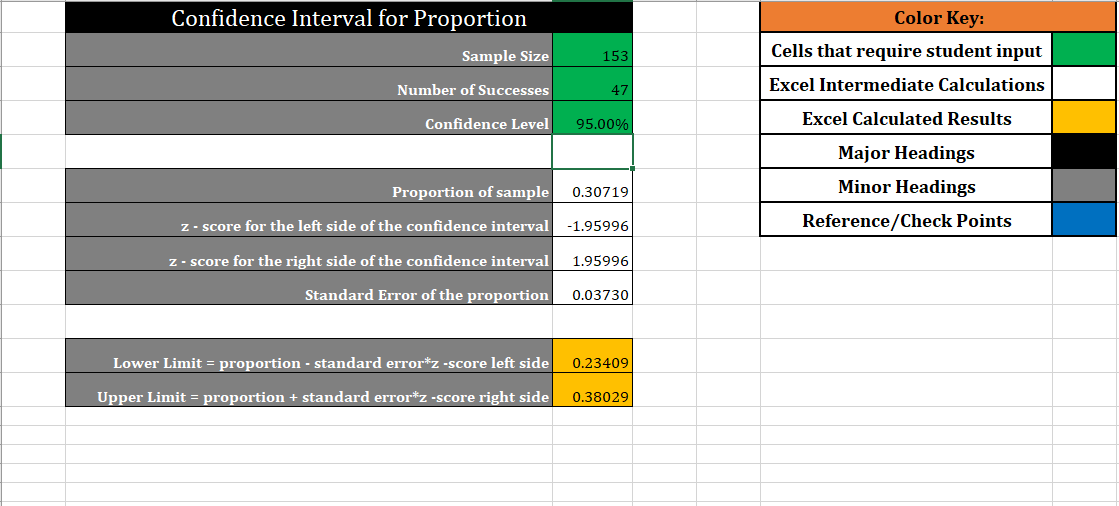
- Use the Confidence Interval template (found in this modules to calculate the confidence interval based on the sample size and the number of successes (the proportion you are interested in). Use a confidence level of 95%.
- What is the calculated confidence interval? How does this compare to the interval in part a using the polls margin of error?.
- Calculate the sample size needed for the given margin of error and see if the poll had enough people surveyed. Use the sample size template.
Data:
Confidence Interval Template:
Sample Size Template:
Quinnipiac University Poll. March 24-28, 2022. N=1,462 adults nationwide. Margin of error a 2.6. "As you may know, President Biden has nominated Ketanji Brown Jackson to the Supreme Court. Do you think the U.S. Senate should confirm Ketanji Brown Jackson to the Supreme Court, or not?" Think it Unsure/ should Do not No answer % % 3/24-28/22 51 30 3/10-14/22 2/25-27/22 % 19 24 29 52 48 24 22 Confidence Interval for Proportion Color Key: Sample Size 153 Cells that require student input Excel Intermediate Calculations Number of successes 47 Confidence Level 95.00% Excel Calculated Results 0.30719 Proportion of sample z-score for the left side of the confidence interval Major Headings Minor Headings Reference/Check Points -1.95996 Z-score for the right side of the confidence interval 1.95996 Standard Error of the proportion 0.03730 Lower Limit = proportion - standard error*z -score left side 0.23409 Upper Limit = proportion + standard error*z-score right side 0.38029 Sample Size for Proportion Estimate of True Proportion 0.75 Sampling Error 0.03 Confidence Level 95.00% Color Key: Cells that require student input Excel Intermediate Calculations Excel Calculated Results Major Headings Minor Headings Reference/Check Points Z Score -1.95996 Calculated Sample Size 801 Quinnipiac University Poll. March 24-28, 2022. N=1,462 adults nationwide. Margin of error a 2.6. "As you may know, President Biden has nominated Ketanji Brown Jackson to the Supreme Court. Do you think the U.S. Senate should confirm Ketanji Brown Jackson to the Supreme Court, or not?" Think it Unsure/ should Do not No answer % % 3/24-28/22 51 30 3/10-14/22 2/25-27/22 % 19 24 29 52 48 24 22 Confidence Interval for Proportion Color Key: Sample Size 153 Cells that require student input Excel Intermediate Calculations Number of successes 47 Confidence Level 95.00% Excel Calculated Results 0.30719 Proportion of sample z-score for the left side of the confidence interval Major Headings Minor Headings Reference/Check Points -1.95996 Z-score for the right side of the confidence interval 1.95996 Standard Error of the proportion 0.03730 Lower Limit = proportion - standard error*z -score left side 0.23409 Upper Limit = proportion + standard error*z-score right side 0.38029 Sample Size for Proportion Estimate of True Proportion 0.75 Sampling Error 0.03 Confidence Level 95.00% Color Key: Cells that require student input Excel Intermediate Calculations Excel Calculated Results Major Headings Minor Headings Reference/Check Points Z Score -1.95996 Calculated Sample Size 801Step by Step Solution
There are 3 Steps involved in it
Step: 1
Get Instant Access to Expert-Tailored Solutions
See step-by-step solutions with expert insights and AI powered tools for academic success
Step: 2
Step: 3
Ace Your Homework with AI
Get the answers you need in no time with our AI-driven, step-by-step assistance
Get Started