

Answered step by step
Verified Expert Solution
Question
1 Approved Answer
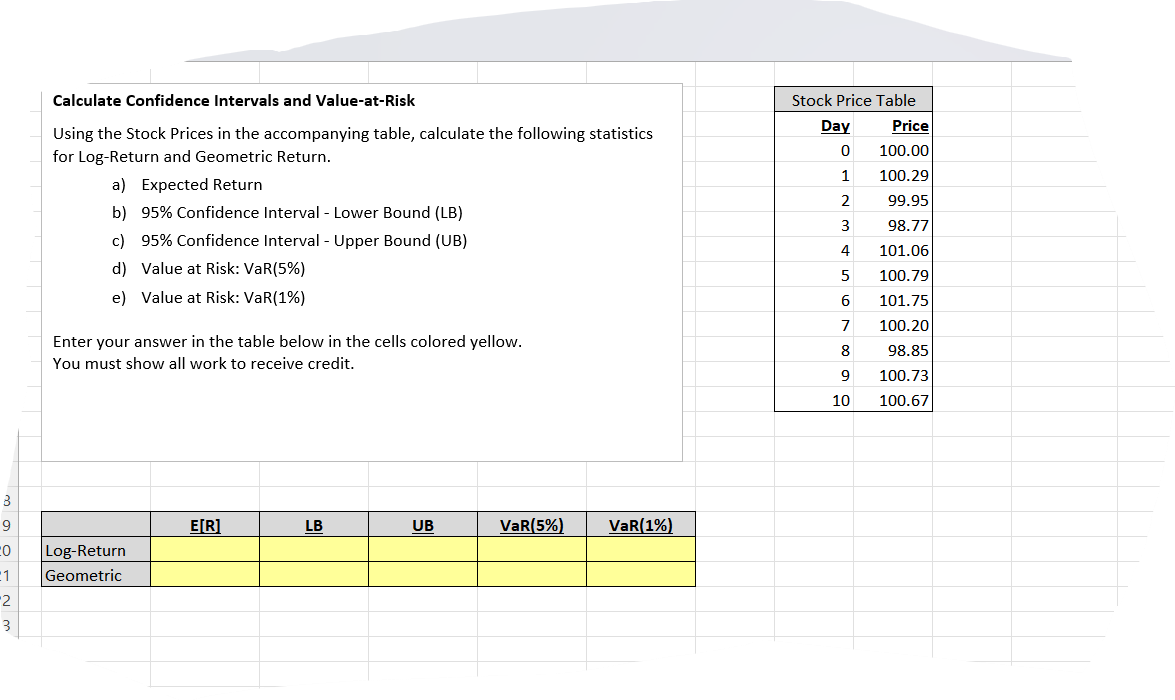
Calculate Confidence Intervals and Value-at-Risk Using the Stock Prices in the accompanying table, calculate the following statistics for Log-Return and Geometric Return. a) Expected Return
Step by Step Solution
There are 3 Steps involved in it
Step: 1

Get Instant Access to Expert-Tailored Solutions
See step-by-step solutions with expert insights and AI powered tools for academic success
Step: 2

Step: 3
Ace Your Homework with AI
Get the answers you need in no time with our AI-driven, step-by-step assistance
Get Started
Asset Allocation Strategies For Mutual Funds Evaluating Performance Risk And Return
Authors: Giuseppe Galloppo
1st Edition
3030761274,3030761282