

Answered step by step
Verified Expert Solution
Question
1 Approved Answer
Calculate cost of debt, and new external equity using the dividend growth model and flotation costs indicated in the summary table. Financial Statements CANDO Industries
Calculate cost of debt, and new external equity using the dividend growth model and flotation costs indicated in the summary table.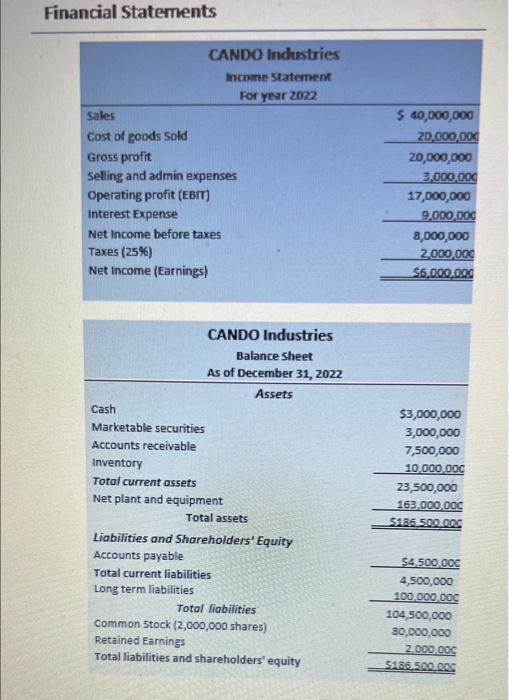
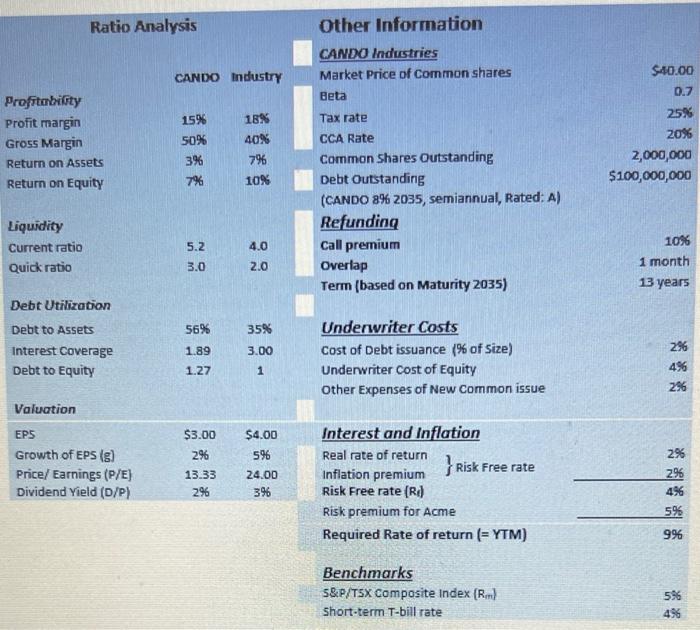
Financial Statements CANDO Industries Income Statement For year 2022 Sales Cost of goods sold Gross profit Selling and admin expenses Operating profit (EBIT) Interest Expense Net Income before taxes Taxes (25%) Net Income (Earnings) $ 40,000,000 20,000,000 20,000,000 3,000,000 17,000,000 9,000,000 8,000,000 2,000,000 $6,000,000 CANDO Industries Balance Sheet As of December 31, 2022 Assets Cash Marketable securities Accounts receivable Inventory Total current assets Net plant and equipment Total assets Liabilities and Shareholders' Equity Accounts payable Total current liabilities Long term liabilities Total liabilities Common Stock (2,000,000 shares) Retained Earnings Total liabilities and shareholders' equity $3,000,000 3,000,000 7,500,000 10,000,000 23,500,000 163,000.00C 5186.5000 $4.500.000 4,500,000 100.000.000 104,500,000 80,000,000 2.000.000 5186,500.00 Ratio Analysis Other Information CANDO Industries Market Price of Common shares Beta CANDO Industry $40.00 0.7 15% Tax rate 25% 20% Profitability Profit margin Gross Margin Return on Assets Return on Equity 50% 3% 18% 40% 796 10% 2,000,000 $100,000,000 CCA Rate Common Shares Outstanding Debt Outstanding (CANDO 8% 2035, semiannual, Rated: A) Refunding Call premium Overlap Term (based on Maturity 2035) Liquidity Current ratio Quick ratio 5.2 4.0 2.0 10% 1 month 3.0 13 years 56% 35% Debt Utilization Debt to Assets Interest Coverage Debt to Equity 3.00 1.89 1.27 Underwriter Costs Cost of Debt issuance (% of size) Underwriter Cost of Equity Other Expenses of New Common issue 1 296 4% 296 Valuation EPS Growth of EPS (5) Price/ Earnings (P/E) Dividend Yield (D/P) $3.00 29 $4.00 596 13.33 296 24.00 396 Interest and Inflation Real rate of return }Risk Free rate Inflation premium Risk Free rate (R) Risk premium for Acme Required Rate of return (= YTM) 2% 296 496 596 996 Benchmarks 5&P/TSX Composite Index (R) Short-term T-bill rate 596 496 Step by Step Solution
There are 3 Steps involved in it
Step: 1

Get Instant Access to Expert-Tailored Solutions
See step-by-step solutions with expert insights and AI powered tools for academic success
Step: 2

Step: 3
Ace Your Homework with AI
Get the answers you need in no time with our AI-driven, step-by-step assistance
Get Started
Asia Bond Monitor September 2017
Authors: Asian Development Bank
1st Edition
9292579452,9292579460