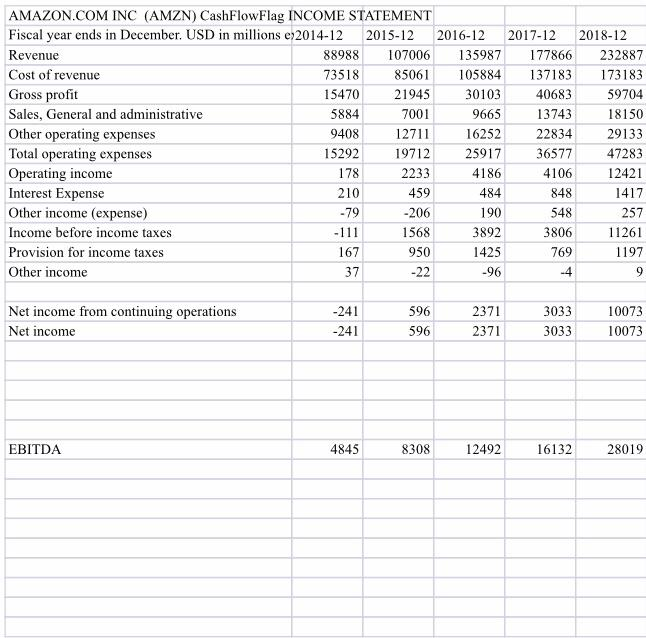
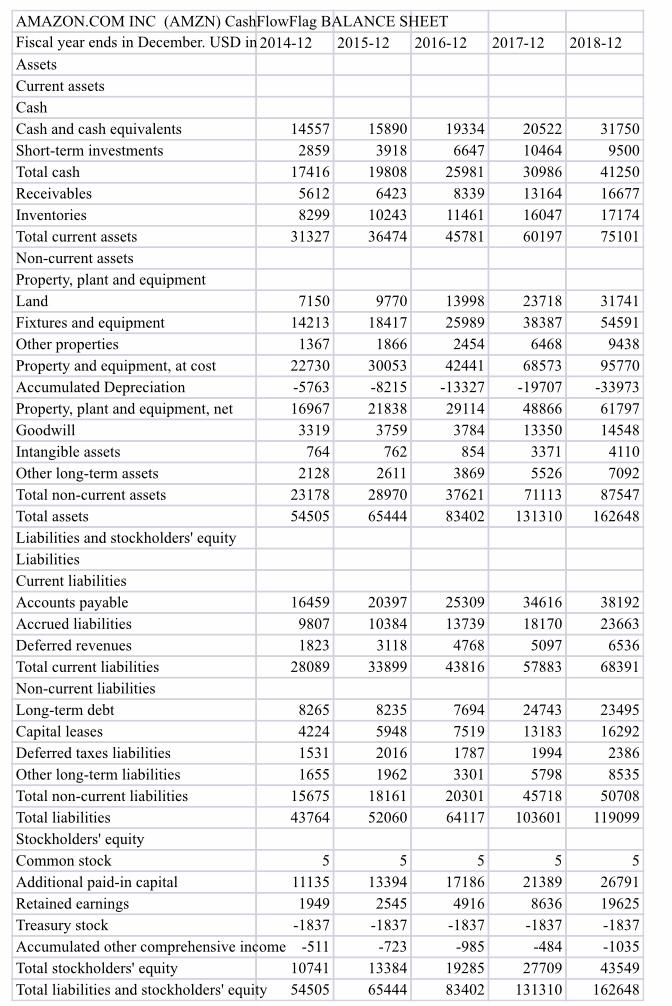
Calculate current ratio, quick ratio, cash ratio, net working capital and change in net working capital for 3 years, EEBITDA margin, net profit margin and ROE, total asset turnover ratio, total debt to asset, TIE, net debt/EBITDA ratio, P/E and EV/EBITDA ratio for 3 last years, D/E ratio.


AMAZON.COM INC (AMZN) CashFlowFlag INCOME STATEMENT Fiscal year ends in December. USD in millions e 2014-12 2015-12 2016-12 2017-12 2018-12 Revenue 88988 107006 135987 177866 232887 Cost of revenue 73518 85061 105884 137183 173183 Gross profit 15470 21945 30103 40683 59704 Sales, General and administrative 5884 7001 9665 13743 18150 Other operating expenses 9408 12711 16252 22834 29133 Total operating expenses 15292 19712 25917 36577 47283 Operating income 178 2233 4186 4106 12421 Interest Expense 210 459 484 848 1417 Other income (expense) -79 -206 190 548 257 Income before income taxes -111 1568 3892 3806 11261 Provision for income taxes 167 950 1425 769 1197 Other income 37 -22 -96 9 596 Net income from continuing operations Net income -241 -241 2371 2371 3033 3033 596 10073 10073 EBITDA 4845 8308 12492 16132 28019 120 AMAZON.COM INC (AMZN) CashFlowFlag BALANCE SHEET Fiscal year ends in December. USD in 2014-12 2015-12 2016-12 2017-12 2018-12 Assets Current assets Cash Cash and cash equivalents 14557 15890 19334 20522 31750 Short-term investments 2859 3918 6647 10464 9500 Total cash 17416 19808 25981 30986 41250 Receivables 5612 6423 8339 13164 16677 Inventories 8299 10243 11461 16047 17174 Total current assets 31327 36474 75101 Non-current assets Property, plant and equipment Land 7150 9770 13998 23718 31741 Fixtures and equipment 14213 18417 25989 38387 54591 Other properties 1367 1866 2454 6468 9438 Property and equipment, at cost 22730 30053 42441 68573 95770 Accumulated Depreciation -5763 -8215 -13327 -19707 -33973 Property, plant and equipment, net 16967 21838 29114 48866 61797 Goodwill 3319 3759 3784 13350 14548 Intangible assets 764 762 854 3371 4110 Other long-term assets 2128 2611 3869 5526 7092 Total non-current assets 23178 28970 37621 71113 87547 Total assets 54505 83402 131310 162648 Liabilities and stockholders' equity Liabilities Current liabilities Accounts payable 16459 20397 25309 34616 38192 Accrued liabilities 9807 10384 13739 18170 23663 Deferred revenues 1823 3118 4768 5097 6536 Total current liabilities 28089 33899 43816 57883 68391 Non-current liabilities Long-term debt 8265 8235 24743 23495 Capital leases 4224 5948 7519 13183 16292 Deferred taxes liabilities 1531 2016 1787 1994 2386 Other long-term liabilities 1655 1962 3301 5798 8535 Total non-current liabilities 15675 18161 20301 45718 50708 Total liabilities 43764 52060 64117 103601 119099 Stockholders' equity Common stock 5 Additional paid-in capital 11135 13394 17186 21389 26791 Retained earnings 1949 2545 4916 8636 19625 Treasury stock -1837 -1837 -1837 -1837 -1837 Accumulated other comprehensive income -511 -723 985 -484 -1035 Total stockholders' equity 10741 13384 19285 27709 43549 Total liabilities and stockholders' equity 54505 65444 8 3402 131310 162648 7694 AMAZON.COM INC (AMZN) CashFlowFlag INCOME STATEMENT Fiscal year ends in December. USD in millions e 2014-12 2015-12 2016-12 2017-12 2018-12 Revenue 88988 107006 135987 177866 232887 Cost of revenue 73518 85061 105884 137183 173183 Gross profit 15470 21945 30103 40683 59704 Sales, General and administrative 5884 7001 9665 13743 18150 Other operating expenses 9408 12711 16252 22834 29133 Total operating expenses 15292 19712 25917 36577 47283 Operating income 178 2233 4186 4106 12421 Interest Expense 210 459 484 848 1417 Other income (expense) -79 -206 190 548 257 Income before income taxes -111 1568 3892 3806 11261 Provision for income taxes 167 950 1425 769 1197 Other income 37 -22 -96 9 596 Net income from continuing operations Net income -241 -241 2371 2371 3033 3033 596 10073 10073 EBITDA 4845 8308 12492 16132 28019 120 AMAZON.COM INC (AMZN) CashFlowFlag BALANCE SHEET Fiscal year ends in December. USD in 2014-12 2015-12 2016-12 2017-12 2018-12 Assets Current assets Cash Cash and cash equivalents 14557 15890 19334 20522 31750 Short-term investments 2859 3918 6647 10464 9500 Total cash 17416 19808 25981 30986 41250 Receivables 5612 6423 8339 13164 16677 Inventories 8299 10243 11461 16047 17174 Total current assets 31327 36474 75101 Non-current assets Property, plant and equipment Land 7150 9770 13998 23718 31741 Fixtures and equipment 14213 18417 25989 38387 54591 Other properties 1367 1866 2454 6468 9438 Property and equipment, at cost 22730 30053 42441 68573 95770 Accumulated Depreciation -5763 -8215 -13327 -19707 -33973 Property, plant and equipment, net 16967 21838 29114 48866 61797 Goodwill 3319 3759 3784 13350 14548 Intangible assets 764 762 854 3371 4110 Other long-term assets 2128 2611 3869 5526 7092 Total non-current assets 23178 28970 37621 71113 87547 Total assets 54505 83402 131310 162648 Liabilities and stockholders' equity Liabilities Current liabilities Accounts payable 16459 20397 25309 34616 38192 Accrued liabilities 9807 10384 13739 18170 23663 Deferred revenues 1823 3118 4768 5097 6536 Total current liabilities 28089 33899 43816 57883 68391 Non-current liabilities Long-term debt 8265 8235 24743 23495 Capital leases 4224 5948 7519 13183 16292 Deferred taxes liabilities 1531 2016 1787 1994 2386 Other long-term liabilities 1655 1962 3301 5798 8535 Total non-current liabilities 15675 18161 20301 45718 50708 Total liabilities 43764 52060 64117 103601 119099 Stockholders' equity Common stock 5 Additional paid-in capital 11135 13394 17186 21389 26791 Retained earnings 1949 2545 4916 8636 19625 Treasury stock -1837 -1837 -1837 -1837 -1837 Accumulated other comprehensive income -511 -723 985 -484 -1035 Total stockholders' equity 10741 13384 19285 27709 43549 Total liabilities and stockholders' equity 54505 65444 8 3402 131310 162648 7694


