Answered step by step
Verified Expert Solution
Link Copied!

Question

1 Approved Answer

Calculate forecast error, MAPE and MSE 2018 2019 Average AVG DD Index January 62,648 63,807 63,228 73,529 0.86 February 48.798 48.748 48.773 73,529 0.66 March

Calculate forecast error, MAPE and MSE
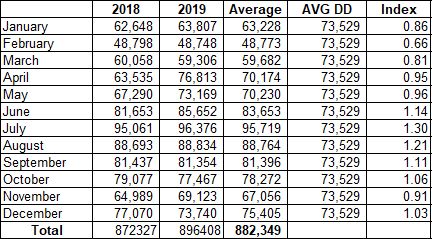
image text in transcribed
2018 2019 Average AVG DD Index January 62,648 63,807 63,228 73,529 0.86 February 48.798 48.748 48.773 73,529 0.66 March 60,058 59,306 59,682 73,529 0.81 April 63,535 76,813 70.174 73,529 0.95 May 67,290 73.169 70.230 73,529 0.96 June 81,653 85,652 83,653 73,529 1.14 July 95,061 96,376 95,719 73.529 1.30 August 88.693 88.834 88,764 73,529 1.21 September 81,437 81,354 81,396 73,529 1.11 October 79,077 77.467 78,272 73,529 1.06 November 64,989 69, 123 67,056 73,529 0.91 December 77.070 73,740 75.405 73,529 1.03 Total 872327 896408 882,349

Step by Step Solution

There are 3 Steps involved in it

Step: 1

blur-text-image

Get Instant Access to Expert-Tailored Solutions

See step-by-step solutions with expert insights and AI powered tools for academic success

Step: 2

blur-text-image

Step: 3

blur-text-image

Ace Your Homework with AI

Get the answers you need in no time with our AI-driven, step-by-step assistance

Get Started

Recommended Textbook for

Supply Chain Logistics Management

Authors: Donald Bowersox, David Closs, M. Bixby Cooper

4th edition

78024056, 978-0078024054

More Books

Students also viewed these General Management questions