Answered step by step
Verified Expert Solution
Question
1 Approved Answer
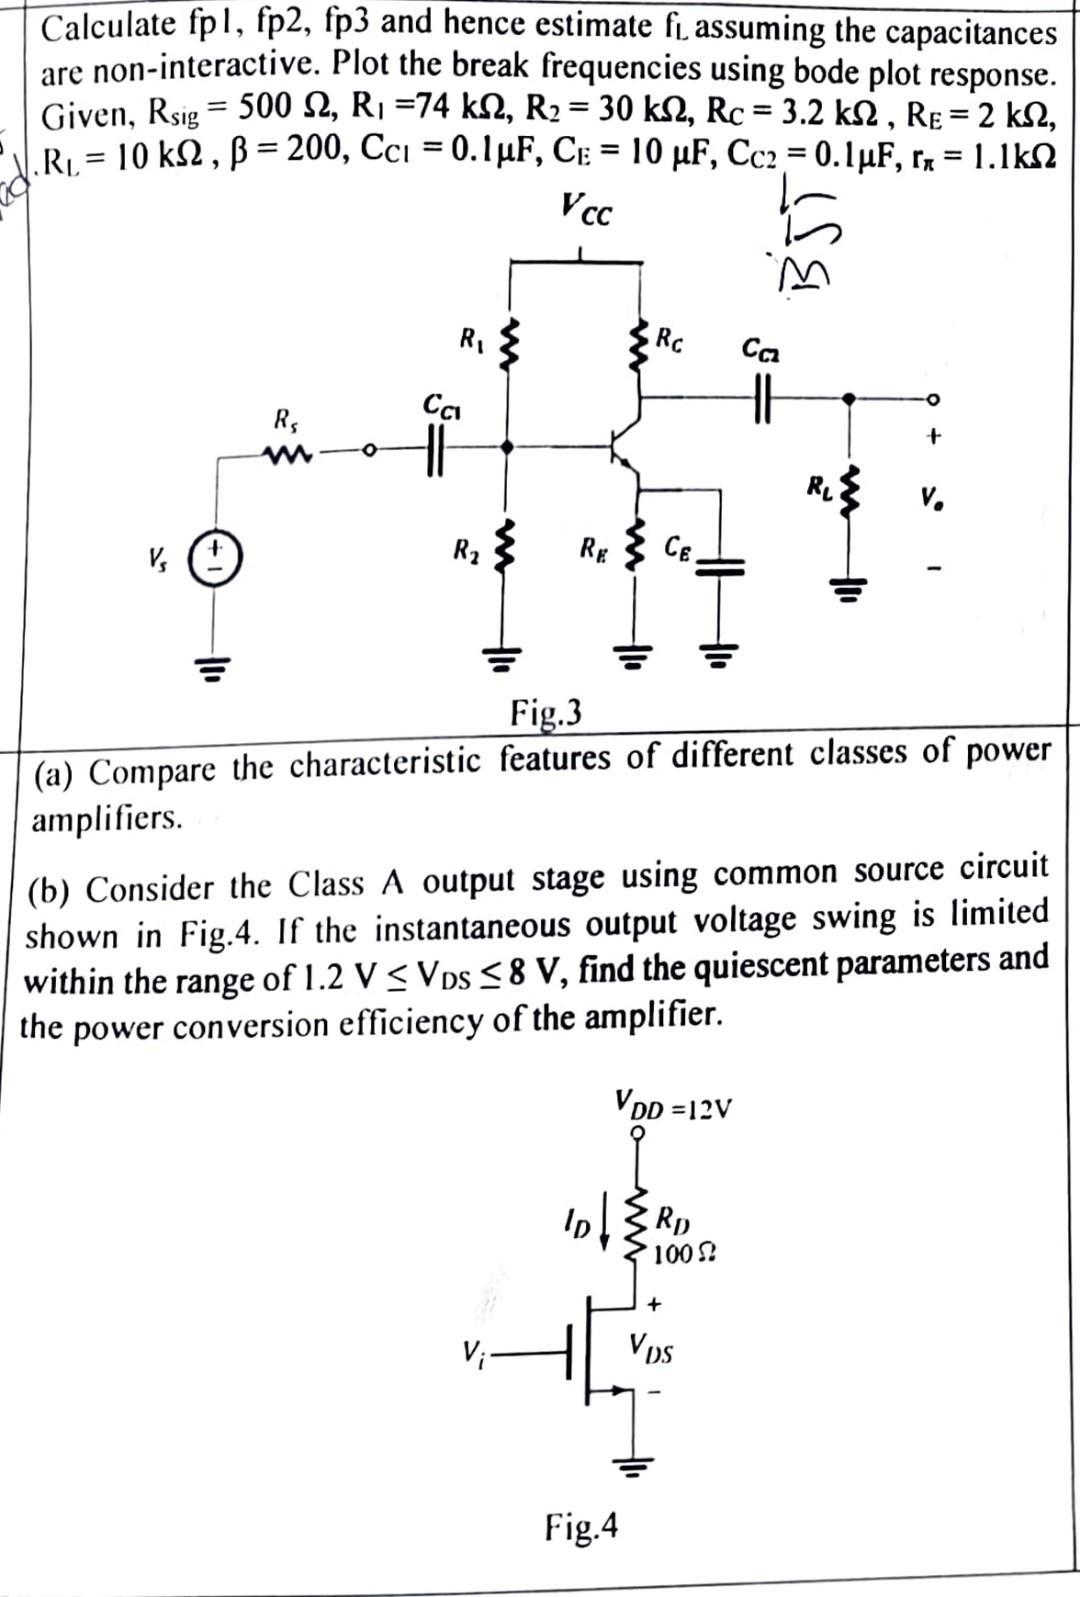
Calculate fp1, fp2, fp3 and hence estimate fi assuming the capacitances are non-interactive. Plot the break frequencies using bode plot response. Given, Rsig =

Calculate fp1, fp2, fp3 and hence estimate fi assuming the capacitances are non-interactive. Plot the break frequencies using bode plot response. Given, Rsig = 500 2, R =74 kN, R = 30 ks, Rc = 3.2 ks, R = 2 ks, |.R = 10 ks, = 200, Cc = 0.1 F, C = 10 F, Cc = 0.1 F, r, = 1.1kM Vcc V R O R Ca R RE V- Rc CE. Fig.3 (a) Compare the characteristic features of different classes of power amplifiers. VDD=12V Fig.4 (b) Consider the Class A output stage using common source circuit shown in Fig.4. If the instantaneous output voltage swing is limited within the range of 1.2 V VDS 8 V, find the quiescent parameters and the power conversion efficiency of the amplifier. ID {RD Ca 1002 + + Vps V.
Step by Step Solution
★★★★★
3.28 Rating (157 Votes )
There are 3 Steps involved in it
Step: 1
Rsig 500ohmR 74KohmR2 30KohmRc 32KohmRE 2Kohm RL 10Kohm3 200Cel 01uFCe2 01uFCE 10Fr 11Kohm Lo...
Get Instant Access to Expert-Tailored Solutions
See step-by-step solutions with expert insights and AI powered tools for academic success
Step: 2

Step: 3

Ace Your Homework with AI
Get the answers you need in no time with our AI-driven, step-by-step assistance
Get Started


