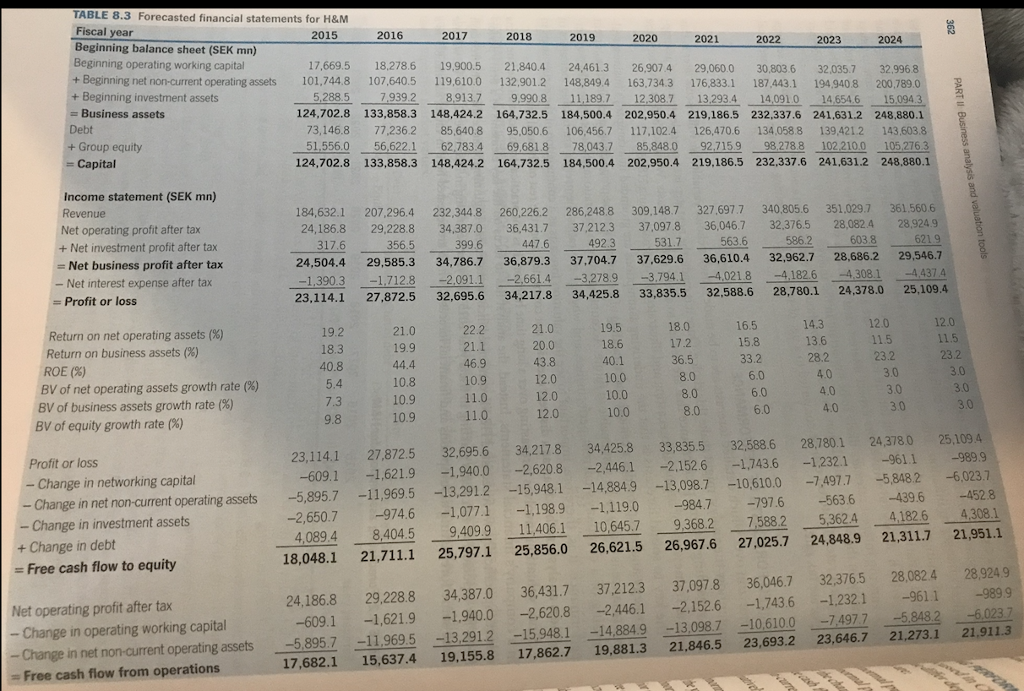
Calculate H&M's cash payouts to its shareholders in the years 2015 - 2024 that are implicitly assumed in the projections in table 8.3. 
TABLE 8.3 Forecasted financial statements for H&M Fiscal 2015 2017 2018 2019 2020 2021 2022 2023 2024 Beginning balance sheet (SEK mn) Beginning operating working capital + Beginning investment assets Debt 17,669.5 18,278.6 19,900.5 21,840.4 24,461.3 26,9074 29,060.0 30,803.6 32,035.7 32.9968 + Beginning net non-current operating assets 101,7448 107,640.5 119,610.0 132,901.2 148,849.4 163,734.3 176,833.1 187 443.1 194 9408 200,789.0 5.288.5 79392 891379,9908111897 12.3087 132934 14,0910 146546 15.094 124,702.8 133,858.3 148,424.2 164,732.5 184,500.4 202,950.4 219,186.5 232,337.6 241.631.2 248,880.1 73,146.8 77,236.2 85,640.8 95,050.6 106,456.7 117,102.4 126,470.6 134.058.8 139,4212 143.603.8 51,556.056,622.1 62783.4 69,681878,043. 85.8480 92.7159 98.2788 102.210.0 105 2763 124,702.8 133,858.3 148,424.2 164,732.5 184,500.4 202,950.4 219,186.5 232,337.6 241,631.2 248,880.1 Business assets + Group equity Capital Income statement (SEK mn) Revenue Net operating profit after tax 184,632.1 207,296.4 232,344.8 260,226.2 286,248.8 309.148.7 327.697.7 340,805.6 351.029.7 361,560 6 24,186.8 29,2288 34,387.0 36,431.7 37,212.3 37,097.8 36,046.7 32.376.5 28,082.4 28,9249 + Net investment profit after tax 356.5 24,504.4 29,585.3 34,786.7 36,879.3 37,704.7 37,629.6 36,610.4 32,962.7 28,686.2 29,546.7 -1390.3 1.7128 -2.091.1 23.114.1 27,872.5 32,695.6 34,217.8 34,425.8 33,835.5 32,588.6 28,780.1 24,378.0 25,109.4 Net business profit after tax Net interest expense after tax 2,661.4 3,278.9 3,794.1 4,021.8 4,182.6 4,3081 -4,437 4 - Profit or loss 12.0 11.5 19.5 14.3 21.0 Return on net operating assets (%) Return on business assets (%) ROE (%) BV of net operating assets growth rate (%) BV of business assets growth rate (%) 36.5 33.2 28.2 40.8 46 10.8 10.0 10.0 BV of equity growth rate (%) 23,114.1 278725 32,695.6 34.217.8 34,425.8 33,835.5 32,588.6 28,7801 24 3780 25,103 Profit or loss -609.1 -1,621.9 -1,940.0 -2,620.8 -2,446.1 2,1526 1.7436 1232.1-9611 -9899 -5895.7-11,9695-132912-15,9481-14.8849-13,098.7-10610.0-7,4977-58482 -2,650.7 -974.6 -1,077.1 1,198.9 -1,119.0 -9847 023 i - Change in networking capital Change in net non-current operating assets - Change in investment assets 797.6 -563.6 439.6 452.8 4,089.4 8404.5 9,4099 11406.1 10,645.7 936827,588253624 4,1826 4,308.1 18,048.1 21,711.1 25,797.1 25,856.0 26,621.5 26,967.6 27,025.7 24,848.9 21,311.7 21,951.1 + Change in debt - Free cash flow to equity 24,186.8 29,228.8 34,387.0 36,431.7 37,212.3 37,097.8 36,046.7 32,376.5 28,0824 28,924.9 -609.1 -1,621.9 1,940.0-2,620.8 -2,446.1-2,152.6 -1,7436 1,232.1 -9611 -989.9 Net operating profit after tax - Change in operating working capital Change in net non-current operating assets -5,895.7 -119695 -13,291.2 -15.948,1 -14.8849 -13,098.7 -10,610074977 5.848.2-6.0237 Free cash flow from operations 17,682.1 15,637.4 19,155.8 17,862.7 19,881.3 21,846.5 23,693.2 23,646.7 21,273.1 21,911.3 TABLE 8.3 Forecasted financial statements for H&M Fiscal 2015 2017 2018 2019 2020 2021 2022 2023 2024 Beginning balance sheet (SEK mn) Beginning operating working capital + Beginning investment assets Debt 17,669.5 18,278.6 19,900.5 21,840.4 24,461.3 26,9074 29,060.0 30,803.6 32,035.7 32.9968 + Beginning net non-current operating assets 101,7448 107,640.5 119,610.0 132,901.2 148,849.4 163,734.3 176,833.1 187 443.1 194 9408 200,789.0 5.288.5 79392 891379,9908111897 12.3087 132934 14,0910 146546 15.094 124,702.8 133,858.3 148,424.2 164,732.5 184,500.4 202,950.4 219,186.5 232,337.6 241.631.2 248,880.1 73,146.8 77,236.2 85,640.8 95,050.6 106,456.7 117,102.4 126,470.6 134.058.8 139,4212 143.603.8 51,556.056,622.1 62783.4 69,681878,043. 85.8480 92.7159 98.2788 102.210.0 105 2763 124,702.8 133,858.3 148,424.2 164,732.5 184,500.4 202,950.4 219,186.5 232,337.6 241,631.2 248,880.1 Business assets + Group equity Capital Income statement (SEK mn) Revenue Net operating profit after tax 184,632.1 207,296.4 232,344.8 260,226.2 286,248.8 309.148.7 327.697.7 340,805.6 351.029.7 361,560 6 24,186.8 29,2288 34,387.0 36,431.7 37,212.3 37,097.8 36,046.7 32.376.5 28,082.4 28,9249 + Net investment profit after tax 356.5 24,504.4 29,585.3 34,786.7 36,879.3 37,704.7 37,629.6 36,610.4 32,962.7 28,686.2 29,546.7 -1390.3 1.7128 -2.091.1 23.114.1 27,872.5 32,695.6 34,217.8 34,425.8 33,835.5 32,588.6 28,780.1 24,378.0 25,109.4 Net business profit after tax Net interest expense after tax 2,661.4 3,278.9 3,794.1 4,021.8 4,182.6 4,3081 -4,437 4 - Profit or loss 12.0 11.5 19.5 14.3 21.0 Return on net operating assets (%) Return on business assets (%) ROE (%) BV of net operating assets growth rate (%) BV of business assets growth rate (%) 36.5 33.2 28.2 40.8 46 10.8 10.0 10.0 BV of equity growth rate (%) 23,114.1 278725 32,695.6 34.217.8 34,425.8 33,835.5 32,588.6 28,7801 24 3780 25,103 Profit or loss -609.1 -1,621.9 -1,940.0 -2,620.8 -2,446.1 2,1526 1.7436 1232.1-9611 -9899 -5895.7-11,9695-132912-15,9481-14.8849-13,098.7-10610.0-7,4977-58482 -2,650.7 -974.6 -1,077.1 1,198.9 -1,119.0 -9847 023 i - Change in networking capital Change in net non-current operating assets - Change in investment assets 797.6 -563.6 439.6 452.8 4,089.4 8404.5 9,4099 11406.1 10,645.7 936827,588253624 4,1826 4,308.1 18,048.1 21,711.1 25,797.1 25,856.0 26,621.5 26,967.6 27,025.7 24,848.9 21,311.7 21,951.1 + Change in debt - Free cash flow to equity 24,186.8 29,228.8 34,387.0 36,431.7 37,212.3 37,097.8 36,046.7 32,376.5 28,0824 28,924.9 -609.1 -1,621.9 1,940.0-2,620.8 -2,446.1-2,152.6 -1,7436 1,232.1 -9611 -989.9 Net operating profit after tax - Change in operating working capital Change in net non-current operating assets -5,895.7 -119695 -13,291.2 -15.948,1 -14.8849 -13,098.7 -10,610074977 5.848.2-6.0237 Free cash flow from operations 17,682.1 15,637.4 19,155.8 17,862.7 19,881.3 21,846.5 23,693.2 23,646.7 21,273.1 21,911.3


