

Question
Calculate Jimenez's 2017 forecasted ratios, compare them with the industry average data, and comment briefly on Jimenez's projected strengths and weaknesses. Assume that there are
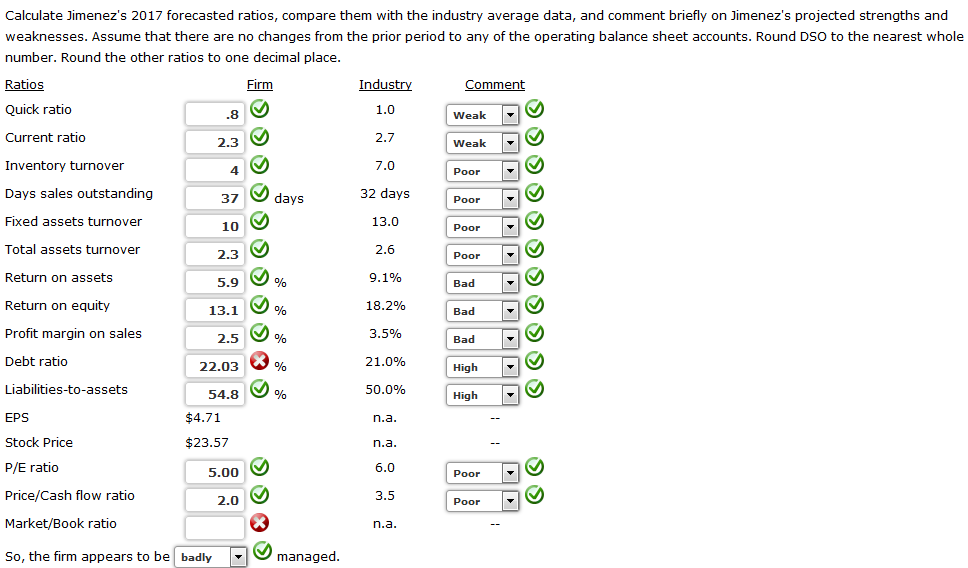
Calculate Jimenez's 2017 forecasted ratios, compare them with the industry average data, and comment briefly on Jimenez's projected strengths and weaknesses. Assume that there are no changes from the prior period to any of the operating balance sheet accounts. Round DSO to the nearest whole number. Round the other ratios to one decimal place.
Jimenez Corporation: Forecasted Balance Sheet as of December 31, 2017
| Assets | |
| Cash | $ 72,000 |
| Accounts receivable | 439,000 |
| Inventories | 894,000 |
| Total current assets | $1,405,000 |
| Fixed assets | 431,000 |
| Total assets | $1,836,000 |
| Liabilities and Equity | |
| Accounts payable | $ 332,000 |
| Notes payable | 100,000 |
| Accruals | 170,000 |
| Total current liabilities | $ 602,000 |
| Long-term debt | 404,290 |
| Common stock | 575,000 |
| Retained earnings | 254,710 |
| Total liabilities and equity | $1,836,000 |
Jimenez Corporation: Forecasted Income Statement for 2017
| Sales | $4,290,000 |
| Cost of goods sold | 3,580,000 |
| Selling, general, and administrative expenses | 370,320 |
| Depreciation and amortization | 159,000 |
| Earnings before taxes (EBT) | $ 180,680 |
| Taxes (40%) | 72,272 |
| Net income | $ 108,408 |
| Jimenez Corporation: Per Share Data for 2017 | |
| EPS | $ 4.71 |
| Cash dividends per share | $ 0.95 |
| P/E ratio | 5.0 |
| Market price (average) | $ 23.57 |
| Number of shares outstanding | 23,000 |
| Industry Ratios | |
| Quick ratio | 1.0 |
| Current ratio | 2.7 |
| Inventory turnover** | 7.0 |
| Days sales outstanding*** | 32.0 days |
| Fixed assets turn over** | 13.0 |
| Total assets turnover** | 2.6 |
| Return on assets | 9.1% |
| Return on equity | 18.2% |
| Profit margin on sales | 3.5% |
| Debt-to-assets ratio | 21.0% |
| Liabilities-to-assets ratio | 50.0% |
| P/E ratio | 6.0 |
| Price/Cash flow ratio | 3.5 |
| Market/Book ratio | 3.5
|
Step by Step Solution
There are 3 Steps involved in it
Step: 1

Get Instant Access to Expert-Tailored Solutions
See step-by-step solutions with expert insights and AI powered tools for academic success
Step: 2

Step: 3
Ace Your Homework with AI
Get the answers you need in no time with our AI-driven, step-by-step assistance
Get Started
The ASQ Auditing Handbook
Authors: J. P. Russell
3rd Edition
0873896661, 978-0873896665