Answered step by step
Verified Expert Solution
Question
1 Approved Answer
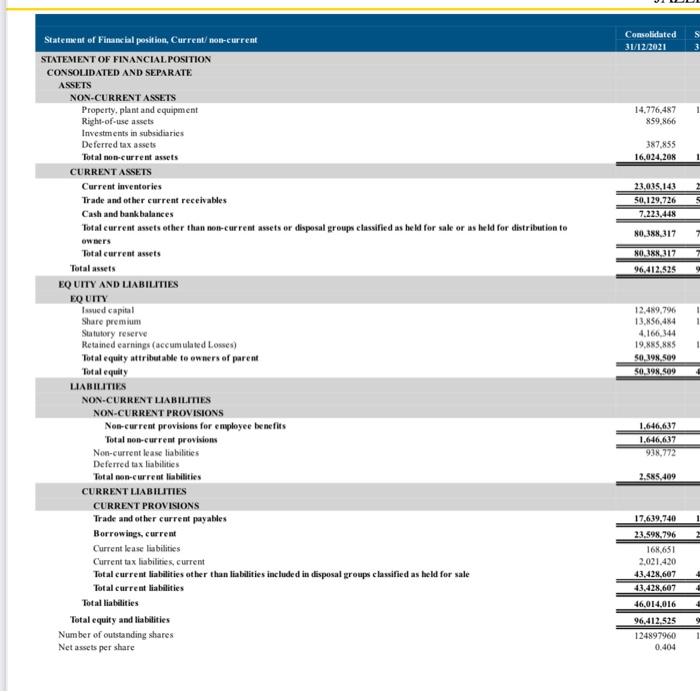
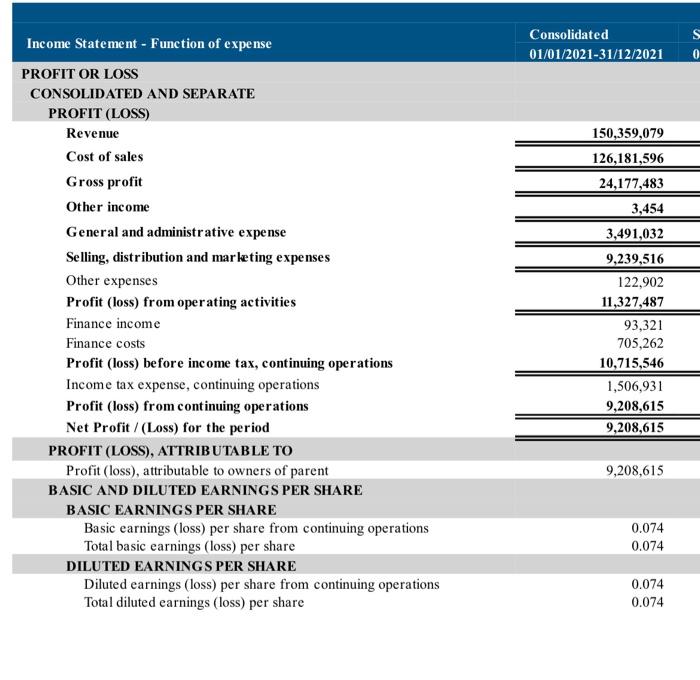
calculate ratio of: Gross profit ratio, Net profit ratio, Gross profit margin, Net profit margin, Operating profit ratio, Return investment, and Quick ratio. then analyzes.
calculate ratio of: Gross profit ratio, Net profit ratio, Gross profit margin, Net profit margin, Operating profit ratio, Return investment, and Quick ratio. then analyzes. 

Consolidated 31/12/2021 1 14,776,487 859,866 387,855 16,024.203 23.035.143 50,129,726 7.223.448 80,388,317 NO. 3XN112 96,412.525 ! 1 Statement of Financial position, Current/ non-current STATEMENT OF FINANCIAL POSITION CONSOLIDATED AND SEPARATE ASSETS NON-CURRENT ASSETS Property, plant and equipment Right-of-use assets Investments in subsidiaries Deferred tax assets Total non-current assets CURRENT ASSETS Current inventories Trade and other current receivables Cash and bank balances Total current assets other than not-current assets or disposal groups classified as held for sale or as held for distribution to owners Total current assets Total assets EQUITY AND LIABILITIES EQUITY Issued capital Share premium Sututory reserve Retained earnings (accumulated Losses) Total equity attributable to owners of parent Total equity LIABILITIES NON-CURRENT LIABILITIES NON-CURRENT PROVISIONS Non-current provisions for employee benefits Total non-current provisions Non-current lease liabilities Deferred tax liabilities Total non-current liabilities CURRENT LIABILITIES CURRENT PROVISIONS Trade and other current payables Borrowings, current Current lease liabilities Current tax liabilities, current Total current liabilities other than liabilities included in disposal groups classified as held for sale Total current liabilities Total liabilities Total equity and liabilities Number of outstanding shares Net assets per share 12,489,796 13.856,484 4,166,344 19.885.885 50,198.500 50,398,509 ! 1.646,637 1.646,637 938.772 2.585,409 17.639,740 1 23,598,796 168,651 2.021.420 43.421,607 43.428,607 46,014,016 96.412.525 124897960 0.404 1 S Consolidated 01/01/2021-31/12/2021 0 150,359,079 126,181,596 Income Statement - Function of expense PROFIT OR LOSS CONSOLIDATED AND SEPARATE PROFIT (LOSS) Revenue Cost of sales Gross profit Other income General and administrative expense Selling, distribution and marketing expenses Other expenses Profit (loss) from operating activities Finance income Finance costs Profit (loss) before income tax, continuing operations Income tax expense, continuing operations Profit (loss) from continuing operations Net Profit/(Loss) for the period PROFIT (LOSS), ATTRIBUTABLE TO Profit (loss), attributable to owners of parent BASIC AND DILUTED EARNINGS PER SHARE BASIC EARNINGS PER SHARE Basic earnings (loss) per share from continuing operations Total basic earnings (loss) per share DILUTED EARNINGS PER SHARE Diluted earnings (loss) per share from continuing operations Total diluted earnings (loss) per share 24,177,483 3,454 3,491,032 9,239,516 122,902 11,327,487 93,321 705,262 10,715,546 1,506,931 9,208,615 9,208,615 9,208,615 0.074 0.074 0.074 0.074 

Step by Step Solution
There are 3 Steps involved in it
Step: 1

Get Instant Access to Expert-Tailored Solutions
See step-by-step solutions with expert insights and AI powered tools for academic success
Step: 2

Step: 3

Ace Your Homework with AI
Get the answers you need in no time with our AI-driven, step-by-step assistance
Get Started


