

Answered step by step
Verified Expert Solution
Question
1 Approved Answer
Calculate: Return on Assets Debt Ratio . Profit Margin Ratio Current Ratio Acid-Test Ratio Gross Margin Ratio Inventory Turnover Days Sates Uncollected Days Sales in
Calculate:
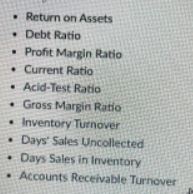
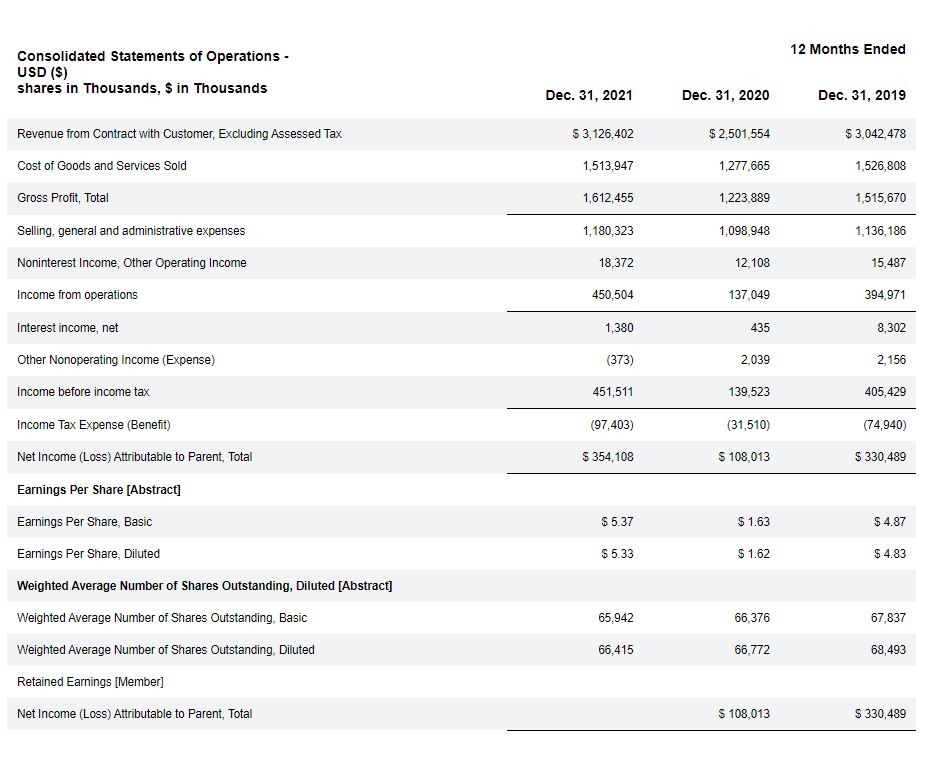
Return on Assets Debt Ratio . Profit Margin Ratio Current Ratio Acid-Test Ratio Gross Margin Ratio Inventory Turnover Days Sates Uncollected Days Sales in Inventory Accounts Receivable Turnover 12 Months Ended Consolidated Statements of Operations - USD ($) shares in Thousands, S in Thousands Dec. 31, 2021 Dec. 31, 2020 Dec. 31, 2019 $ 3,126,402 $ 2,501,554 $ 3,042,478 Revenue from Contract with customer, Excluding Assessed Tax Cost of Goods and Services Sold Gross Profit, Total 1,513,947 1,277,665 1,526,808 1,612,455 1,223,889 1,515,670 Selling, general and administrative expenses 1,180,323 1,098,948 1,136,186 Noninterest Income, Other Operating Income 18,372 12,108 15,487 Income from operations 450,504 137,049 394,971 Interest income, net 1,380 435 8,302 Other Nonoperating Income (Expense) (373) 2,039 2,156 Income before income tax 451,511 139,523 405,429 (97,403) (31,510) (74,940) Income Tax Expense (Benefit) Net Income (Loss) Attributable to Parent, Total $ 354,108 $ 108,013 $ 330,489 $5.37 $ 1.63 $ 4.87 Earnings Per Share [Abstract] Earnings Per Share. Basic Earnings Per Share, Diluted Weighted Average Number of shares Outstanding, Diluted [Abstract] $5.33 $ 1.62 $ 4.83 Weighted Average Number of Shares Outstanding, Basic 65,942 66,376 67,837 Weighted Average Number of Shares Outstanding, Diluted 66,415 66,772 68,493 Retained Earnings [Member] Net Income (Loss) Attributable to Parent, Total S 108,013 $ 330,489 Return on Assets Debt Ratio . Profit Margin Ratio Current Ratio Acid-Test Ratio Gross Margin Ratio Inventory Turnover Days Sates Uncollected Days Sales in Inventory Accounts Receivable Turnover 12 Months Ended Consolidated Statements of Operations - USD ($) shares in Thousands, S in Thousands Dec. 31, 2021 Dec. 31, 2020 Dec. 31, 2019 $ 3,126,402 $ 2,501,554 $ 3,042,478 Revenue from Contract with customer, Excluding Assessed Tax Cost of Goods and Services Sold Gross Profit, Total 1,513,947 1,277,665 1,526,808 1,612,455 1,223,889 1,515,670 Selling, general and administrative expenses 1,180,323 1,098,948 1,136,186 Noninterest Income, Other Operating Income 18,372 12,108 15,487 Income from operations 450,504 137,049 394,971 Interest income, net 1,380 435 8,302 Other Nonoperating Income (Expense) (373) 2,039 2,156 Income before income tax 451,511 139,523 405,429 (97,403) (31,510) (74,940) Income Tax Expense (Benefit) Net Income (Loss) Attributable to Parent, Total $ 354,108 $ 108,013 $ 330,489 $5.37 $ 1.63 $ 4.87 Earnings Per Share [Abstract] Earnings Per Share. Basic Earnings Per Share, Diluted Weighted Average Number of shares Outstanding, Diluted [Abstract] $5.33 $ 1.62 $ 4.83 Weighted Average Number of Shares Outstanding, Basic 65,942 66,376 67,837 Weighted Average Number of Shares Outstanding, Diluted 66,415 66,772 68,493 Retained Earnings [Member] Net Income (Loss) Attributable to Parent, Total S 108,013 $ 330,489
Step by Step Solution
There are 3 Steps involved in it
Step: 1

Get Instant Access to Expert-Tailored Solutions
See step-by-step solutions with expert insights and AI powered tools for academic success
Step: 2

Step: 3
Ace Your Homework with AI
Get the answers you need in no time with our AI-driven, step-by-step assistance
Get Started
Fundamentals Of Strategy
Authors: Gerry Johnson, Kevan Scholes, Richard Whittington
2nd Edition
0273713108, 9780273713104