

Answered step by step
Verified Expert Solution
Question
1 Approved Answer
calculate risk and return for 4 years consecutively Group Financial Highlights Year Ended Year Ended Year Ended Year Ended Year Ended 30 June 2021 31
calculate risk and return for 4 years consecutively 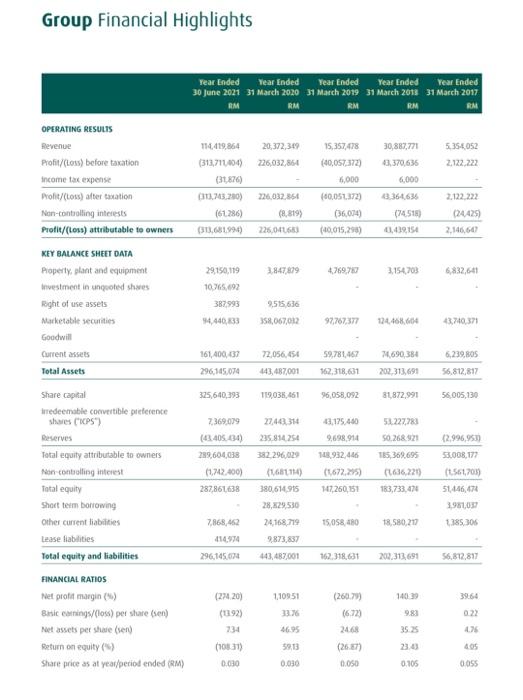
Group Financial Highlights Year Ended Year Ended Year Ended Year Ended Year Ended 30 June 2021 31 March 2020 31 March 2019 31 March 2013 31 March 2017 RM RM RM RM RM OPERATING RESULTS 20,372,349 226,032,854 30,887,771 3,370,635 5356052 2.122.222 6,000 Revenue Profit/(Loss) before taxation income tax expense Profit/(Loss) alter caxation Non-controlling interests Profit/(Loss) attributable to owners 114.419,864 (313,711,004) (31,876) 03.200) (61286) (313,681994) 15,357,478 (40,057.372) 6,000 (60,052372) (36,004) (40.015,298) 2.122.222 226,032.354 (8,819) 226,046 3.364636 (74518 11,09154 (24425) 2,146,607 3,847,879 476978 3,154 703 6,832,641 KEY BALANCE SHEET DATA Property, plant and equipment Investment in unguoted shes Right of use assets Marketable securities Goodwill Current assets 29150,119 10.765.692 387,993 4,440,633 9,595.636 358,067,012 97,767377 124.468.604 43,740.371 161,400,37 296,145.074 72,056, 454 143,487,001 59.781,467 162,318,631 74.690,384 202,313,691 6,239,805 56.812,817 Total Assets 325,640,393 119,035,461 96,058,092 81,872,991 56,005,130 43,175.400 7,369,079 (43.405.034) 9,698.914 (2.996,950 289,60408 27.40.314 235.814254 382 296,029 (168111) 380,614.95 28,29530 5008,177 51.227,783 50,268.921 185,369,693 (1636.2219 183,733.474 1932.446 (1672.2015 147,260,151 (1,712,400) 287,861,638 (1.561,703) 51.446,474 3.98105 2385, 305 24.168.719 15,058, 180 18.580,217 Share capital bredeemable convertible preference shares (CPS) Deserves Total equity attributable to owners Mon controlling interest Total equity Short term borrowing Other current liabilities lease liabilities Total equity and liabilities FINANCIAL RATIOS Net profit margin() Butic catings/(los) per stare (sen) Net assets per shave (sen Return on equity Share price as at yeat/period ended (RM) 7,868,462 11494 2,873,837 443, 487,001 296,145.074 162,318.631 203.313.691 56,812,897 110951 140:39 39264 (2720) (1192) 734 9.83 0.22 (260.79 (6.723 2468 (267) 0.050 35 176 5913 234 (1031) 0.030 0.030 0.105 0055 Group Financial Highlights Year Ended Year Ended Year Ended Year Ended Year Ended 30 June 2021 31 March 2020 31 March 2019 31 March 2013 31 March 2017 RM RM RM RM RM OPERATING RESULTS 20,372,349 226,032,854 30,887,771 3,370,635 5356052 2.122.222 6,000 Revenue Profit/(Loss) before taxation income tax expense Profit/(Loss) alter caxation Non-controlling interests Profit/(Loss) attributable to owners 114.419,864 (313,711,004) (31,876) 03.200) (61286) (313,681994) 15,357,478 (40,057.372) 6,000 (60,052372) (36,004) (40.015,298) 2.122.222 226,032.354 (8,819) 226,046 3.364636 (74518 11,09154 (24425) 2,146,607 3,847,879 476978 3,154 703 6,832,641 KEY BALANCE SHEET DATA Property, plant and equipment Investment in unguoted shes Right of use assets Marketable securities Goodwill Current assets 29150,119 10.765.692 387,993 4,440,633 9,595.636 358,067,012 97,767377 124.468.604 43,740.371 161,400,37 296,145.074 72,056, 454 143,487,001 59.781,467 162,318,631 74.690,384 202,313,691 6,239,805 56.812,817 Total Assets 325,640,393 119,035,461 96,058,092 81,872,991 56,005,130 43,175.400 7,369,079 (43.405.034) 9,698.914 (2.996,950 289,60408 27.40.314 235.814254 382 296,029 (168111) 380,614.95 28,29530 5008,177 51.227,783 50,268.921 185,369,693 (1636.2219 183,733.474 1932.446 (1672.2015 147,260,151 (1,712,400) 287,861,638 (1.561,703) 51.446,474 3.98105 2385, 305 24.168.719 15,058, 180 18.580,217 Share capital bredeemable convertible preference shares (CPS) Deserves Total equity attributable to owners Mon controlling interest Total equity Short term borrowing Other current liabilities lease liabilities Total equity and liabilities FINANCIAL RATIOS Net profit margin() Butic catings/(los) per stare (sen) Net assets per shave (sen Return on equity Share price as at yeat/period ended (RM) 7,868,462 11494 2,873,837 443, 487,001 296,145.074 162,318.631 203.313.691 56,812,897 110951 140:39 39264 (2720) (1192) 734 9.83 0.22 (260.79 (6.723 2468 (267) 0.050 35 176 5913 234 (1031) 0.030 0.030 0.105 0055 Step by Step Solution
There are 3 Steps involved in it
Step: 1

Get Instant Access to Expert-Tailored Solutions
See step-by-step solutions with expert insights and AI powered tools for academic success
Step: 2

Step: 3
Ace Your Homework with AI
Get the answers you need in no time with our AI-driven, step-by-step assistance
Get Started
The Law And Economics Of Patent Damages, Antitrust, And Legal Process
Authors: James Langenfeld, Frank Fagan, Samuel Clark
2nd Edition
1800710259, 9781800710252