Answered step by step
Verified Expert Solution
Question
1 Approved Answer
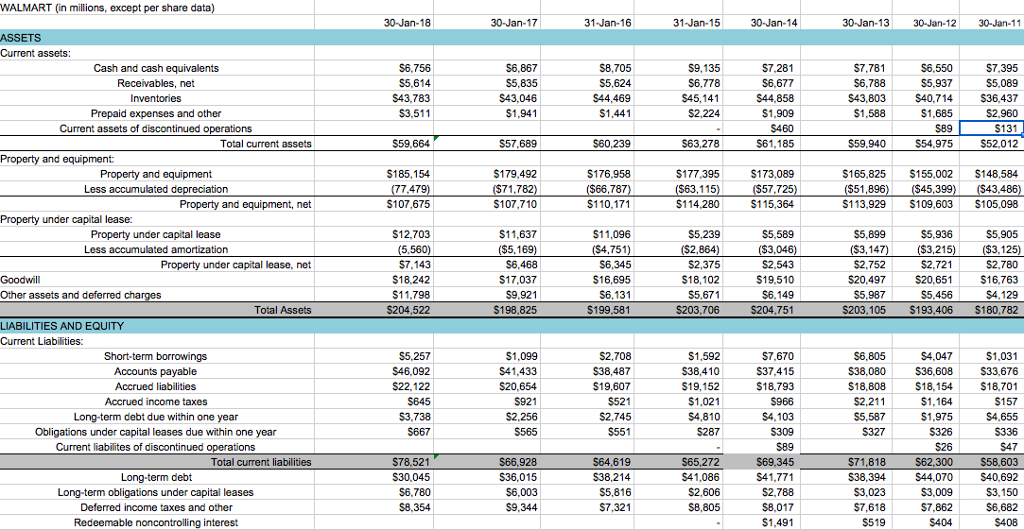
Calculate (show calculations) the following ratios for Wal-mart for the years ended on Janurary 31, 2018, Janurary 31, 2017, Janurary 31, 2018. A) Fixed Asset
Calculate (show calculations) the following ratios for Wal-mart for the years ended on Janurary 31, 2018, Janurary 31, 2017, Janurary 31, 2018. A) Fixed Asset Turnover
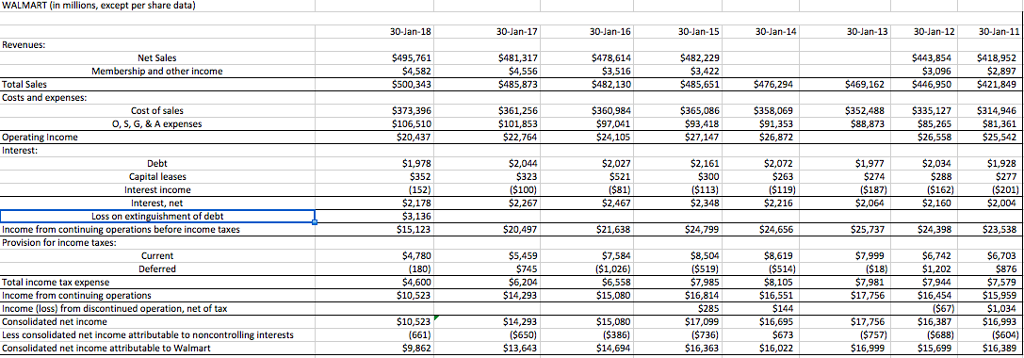
WALMART (in millions, except per share data) 30-Jan-18 30-Jan-17 30-Jan-16 $478,614 482,130 360,984 30-Jan-15 30-Jan-14 30-Jan-13 30-Jan-11 443,854 $418,952 $446,950 421,849 30-Jan-12 Net Sales Membership and other income $481,317 $485,873 $361,256 $482,229 $485,651 $365,086 $3,096 Total Sales Costs and expenses: $500,343 S476.294 $469,162 Cost of sales $373,396 $106,510 358,069 $91,353 $352,488 $88,873 335,127 $314,946 $81,361 $26,558$25.542 O, S, G, & A e $101,853 $97,041 $93,418 85,265 Operating Income Interest: $2,034 $288 Debt Capital leases Interest income nterest, net Loss on extinguishment of debt $1,978 2,044 $2,027 2,161 $1,977 $1,928 $277 (152) $2,467 2,348 $24,799 8,504 7.,985 $2,004 Income from contin Provision for income taxes: s before income taxes 515,123 Current $7,584 $7,999 $1,202 7,981 947.579 Total income tax expense Income from contin Income (loss) from discontinued operation, net of tax Consolidated net income Less consolidated net income attributable to noncontrolling interests Consolidated net income attributable to Walmart 10,523 $14,293 $15,080 $16,814 $17,099 $16,363 ations ($67) 16,387 ($688) $1,034 $16,993 ($604) 16,389 $10,523 $14,293 ($650) $15,080 $16,695 $17,756 $16,022 $16,999 15,699Step by Step Solution
There are 3 Steps involved in it
Step: 1
Get Instant Access to Expert-Tailored Solutions
See step-by-step solutions with expert insights and AI powered tools for academic success
Step: 2
Step: 3
Ace Your Homework with AI
Get the answers you need in no time with our AI-driven, step-by-step assistance
Get Started