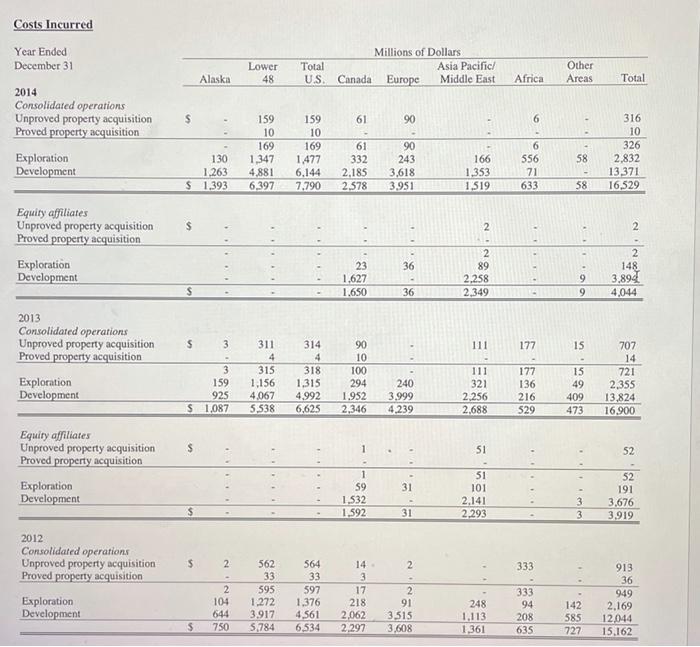
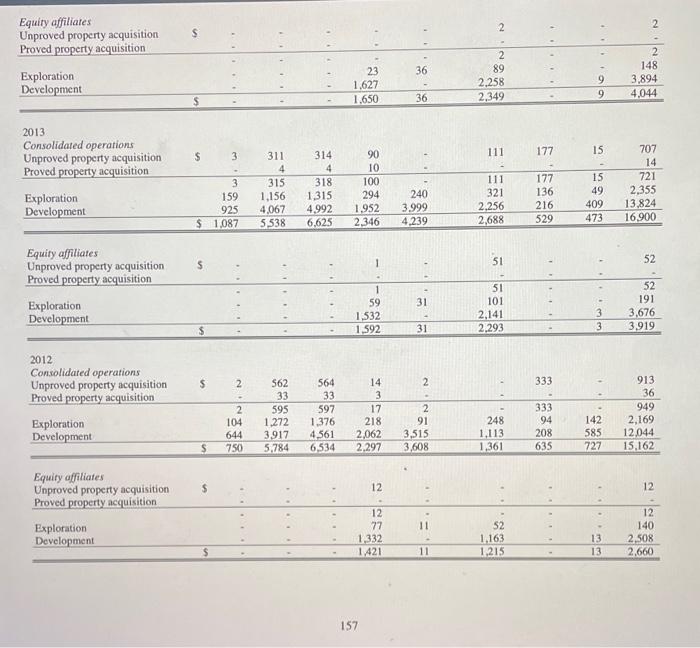
Calculate the 2014 Finding Cost Ratio for "Lower 48" -- the geographic area in the table. Hint: See page 157 of the 10-K report for cost data. Note: Compute the above ratio in for ConocoPhillips using the 2014 10-K filing you have been provided on the course content. Type your answers and show your work. / credit is given if a question is attempted but it is wrong. If a student does not provide evidence of their work, credit will not be given - so be sure to show your calculations. As always, make sure you have watched the videos over these calculations! Lower 48 Millions of Dollars Asia Pacific/ Canada Europe Middle East Total US Alaska Other Areas Africa Total Costs Incurred Year Ended December 31 2014 Consolidated operations Unproved property acquisition Proved property acquisition Exploration Development 61 90 6 159 10 169 1,347 4,881 6.397 159 10 169 1,477 6.144 7,790 130 1.263 $ 1,393 58 61 332 2.185 2.578 316 10 326 2,832 13,371 16,529 90 243 3,618 3,951 6 556 71 633 166 1,353 1.519 . 58 $ - 2 2 Equity affiliates Unproved property acquisition Proved property acquisition Exploration Development 2 36 148 23 1.627 1.650 2 89 2.258 2,349 9 9 3,894 4,044 36 $ 3 111 177 15 2013 Consolidated operations Unproved property acquisition Proved property acquisition Exploration Development . 3 159 925 $ 1,087 311 4 315 1,156 4,067 5.538 314 4 318 1.315 4.992 6,625 90 10 100 294 1.952 2,346 240 3.999 4,239 111 321 2.256 2.688 177 136 216 529 15 49 409 473 707 14 721 2.355 13,824 16.900 - - 1 51 - . 52 Equity affiliates Unproved property acquisition Proved property acquisition Exploration Development 31 1 59 1.532 1.592 51 101 2.141 2.293 52 191 3,676 3,919 31 2012 Consolidated operations Unproved property acquisition Proved property acquisition $ 2 2 333 913 36 Exploration Development 2 104 644 750 562 33 595 1,272 3.917 5,784 564 33 597 1,376 4.561 6.534 14 3 17 218 2.062 2.297 2 91 3.515 3,608 248 1,113 1,361 333 94 208 635 142 585 727 949 2.169 12,044 15,162 $ 2 2 Equity affiliates Unproved property acquisition Proved property acquisition S - 36 Exploration Development 23 1.627 1.650 2 89 2,258 2,349 2 148 3,894 4,044 9 9 S 36 2013 Consolidated operations Unproved property acquisition Proved property acquisition 177 $ 15 111 3 111 311 4 315 1,156 4.067 5,538 314 4 318 1,315 4,992 6,625 3 159 925 $ 1.087 90 10 100 294 1,952 2,346 321 Exploration Development 707 14 721 2,355 13,824 16.900 177 136 216 529 240 3.999 4,239 15 49 409 473 2,256 2,688 S 1 52 51 Equity affiliates Unproved property acquisition Proved property acquisition Exploration Development 31 1 59 1,532 1,592 51 101 2,141 2,293 52 191 3.676 3,919 3 3 31 $ 2 564 2 333 2012 Consolidated operations Unproved property acquisition Proved property acquisition Exploration Development 2 104 644 750 562 33 595 1,272 3,917 5,784 33 597 1,376 4,561 6,534 14 3 17 218 2,062 2.297 2 91 3,515 3,608 913 36 949 2,169 12.044 15,162 333 94 208 635 248 1,113 1,361 142 585 727 S $ 12 12 Equity affiliates Unproved property acquisition Proved property acquisition Exploration Development 12 77 1,332 1,421 52 1.163 1,215 12 140 2,508 2,660 13 13 11 157 Calculate the 2014 Finding Cost Ratio for "Lower 48" -- the geographic area in the table. Hint: See page 157 of the 10-K report for cost data. Note: Compute the above ratio in for ConocoPhillips using the 2014 10-K filing you have been provided on the course content. Type your answers and show your work. / credit is given if a question is attempted but it is wrong. If a student does not provide evidence of their work, credit will not be given - so be sure to show your calculations. As always, make sure you have watched the videos over these calculations! Lower 48 Millions of Dollars Asia Pacific/ Canada Europe Middle East Total US Alaska Other Areas Africa Total Costs Incurred Year Ended December 31 2014 Consolidated operations Unproved property acquisition Proved property acquisition Exploration Development 61 90 6 159 10 169 1,347 4,881 6.397 159 10 169 1,477 6.144 7,790 130 1.263 $ 1,393 58 61 332 2.185 2.578 316 10 326 2,832 13,371 16,529 90 243 3,618 3,951 6 556 71 633 166 1,353 1.519 . 58 $ - 2 2 Equity affiliates Unproved property acquisition Proved property acquisition Exploration Development 2 36 148 23 1.627 1.650 2 89 2.258 2,349 9 9 3,894 4,044 36 $ 3 111 177 15 2013 Consolidated operations Unproved property acquisition Proved property acquisition Exploration Development . 3 159 925 $ 1,087 311 4 315 1,156 4,067 5.538 314 4 318 1.315 4.992 6,625 90 10 100 294 1.952 2,346 240 3.999 4,239 111 321 2.256 2.688 177 136 216 529 15 49 409 473 707 14 721 2.355 13,824 16.900 - - 1 51 - . 52 Equity affiliates Unproved property acquisition Proved property acquisition Exploration Development 31 1 59 1.532 1.592 51 101 2.141 2.293 52 191 3,676 3,919 31 2012 Consolidated operations Unproved property acquisition Proved property acquisition $ 2 2 333 913 36 Exploration Development 2 104 644 750 562 33 595 1,272 3.917 5,784 564 33 597 1,376 4.561 6.534 14 3 17 218 2.062 2.297 2 91 3.515 3,608 248 1,113 1,361 333 94 208 635 142 585 727 949 2.169 12,044 15,162 $ 2 2 Equity affiliates Unproved property acquisition Proved property acquisition S - 36 Exploration Development 23 1.627 1.650 2 89 2,258 2,349 2 148 3,894 4,044 9 9 S 36 2013 Consolidated operations Unproved property acquisition Proved property acquisition 177 $ 15 111 3 111 311 4 315 1,156 4.067 5,538 314 4 318 1,315 4,992 6,625 3 159 925 $ 1.087 90 10 100 294 1,952 2,346 321 Exploration Development 707 14 721 2,355 13,824 16.900 177 136 216 529 240 3.999 4,239 15 49 409 473 2,256 2,688 S 1 52 51 Equity affiliates Unproved property acquisition Proved property acquisition Exploration Development 31 1 59 1,532 1,592 51 101 2,141 2,293 52 191 3.676 3,919 3 3 31 $ 2 564 2 333 2012 Consolidated operations Unproved property acquisition Proved property acquisition Exploration Development 2 104 644 750 562 33 595 1,272 3,917 5,784 33 597 1,376 4,561 6,534 14 3 17 218 2,062 2.297 2 91 3,515 3,608 913 36 949 2,169 12.044 15,162 333 94 208 635 248 1,113 1,361 142 585 727 S $ 12 12 Equity affiliates Unproved property acquisition Proved property acquisition Exploration Development 12 77 1,332 1,421 52 1.163 1,215 12 140 2,508 2,660 13 13 11 157