Question
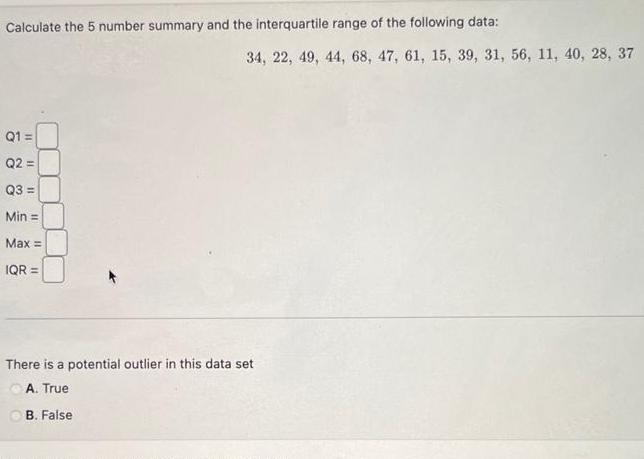
Calculate the 5 number summary and the interquartile range of the following data: Q1= Q2 = Q3= Min= Max= IQR = 34, 22, 49,

Calculate the 5 number summary and the interquartile range of the following data: Q1= Q2 = Q3= Min= Max= IQR = 34, 22, 49, 44, 68, 47, 61, 15, 39, 31, 56, 11, 40, 28, 37 There is a potential outlier in this data set A. True B. False
Step by Step Solution
There are 3 Steps involved in it
Step: 1
Sure The 5 number summary is shown below Statistic Value Min 110 Q1 295 Q2 390 Q3 480 Max ...
Get Instant Access to Expert-Tailored Solutions
See step-by-step solutions with expert insights and AI powered tools for academic success
Step: 2

Step: 3

Ace Your Homework with AI
Get the answers you need in no time with our AI-driven, step-by-step assistance
Get StartedRecommended Textbook for
Income Tax Fundamentals 2013
Authors: Gerald E. Whittenburg, Martha Altus Buller, Steven L Gill
31st Edition
1111972516, 978-1285586618, 1285586611, 978-1285613109, 978-1111972516
Students also viewed these Statistics questions
Question
Answered: 1 week ago
Question
Answered: 1 week ago
Question
Answered: 1 week ago
Question
Answered: 1 week ago
Question
Answered: 1 week ago
Question
Answered: 1 week ago
Question
Answered: 1 week ago
Question
Answered: 1 week ago
Question
Answered: 1 week ago
Question
Answered: 1 week ago
Question
Answered: 1 week ago
Question
Answered: 1 week ago
Question
Answered: 1 week ago
Question
Answered: 1 week ago
Question
Answered: 1 week ago
Question
Answered: 1 week ago
Question
Answered: 1 week ago
Question
Answered: 1 week ago
Question
Answered: 1 week ago
Question
Answered: 1 week ago
Question
Answered: 1 week ago
View Answer in SolutionInn App


