

Answered step by step
Verified Expert Solution
Question
1 Approved Answer
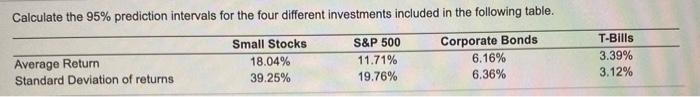
Calculate the 95% prediction intervals for the four different investments included in the following table. Small Stocks 18.04% 39.25% Average Return Standard Deviation of returns
Step by Step Solution
There are 3 Steps involved in it
Step: 1

Get Instant Access to Expert-Tailored Solutions
See step-by-step solutions with expert insights and AI powered tools for academic success
Step: 2

Step: 3
Ace Your Homework with AI
Get the answers you need in no time with our AI-driven, step-by-step assistance
Get Started
Managerial Finance In A Canadian Setting
Authors: X. Lusztig, X. Schwab
4th Edition